By Samir Al Khoury,
Most major US stock indices closed with losses yesterday. On the other hand, the VIX Fear and Volatility Index, which expresses investors’ expectations for price movement in the stock market, rose to 19.56 points yesterday, which is its highest level since October 31, 2023, which indicates investors’ turmoil and discomfort in the American stock markets.
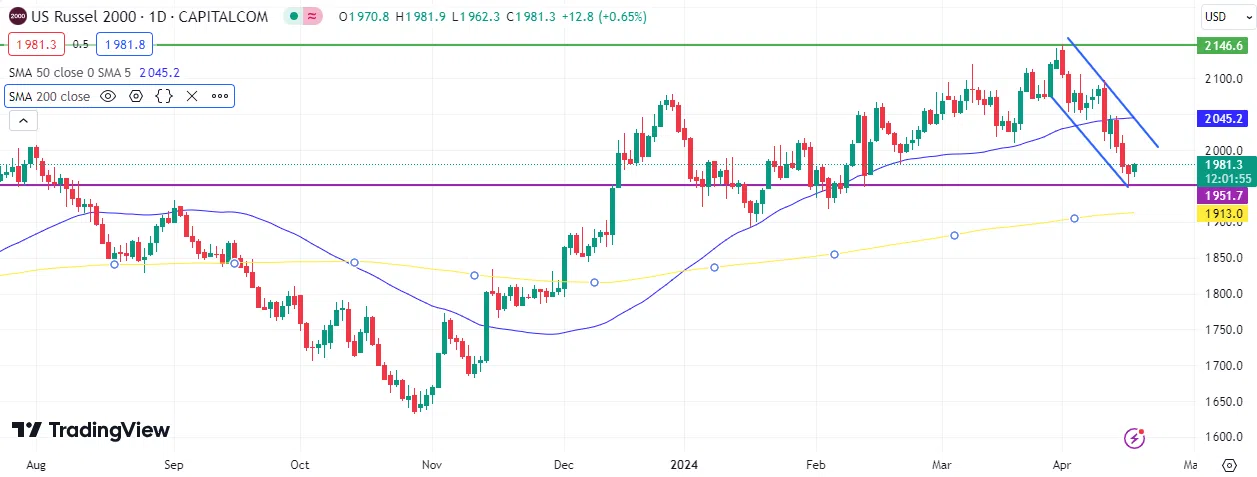
The Russell 2000 index, which is an index of small and medium-sized stocks in the United States of America, continues to decline for the fourth day in a row, recording 1,951.7 points yesterday, which is its lowest level since February 8, 2024. It has declined by about 3% since the beginning of this year until today. The picture appears to be discouraging, and the downward channel is prevailing at this stage, especially since these stocks are negatively affected by interest rates, which appear to remain high for a long period of time, and this is what Federal Reserve Chairman Jerome Powell alluded to yesterday, adding that inflation is still far from the 2% target.
The Russell 2000 index is also affected by economic conditions, as most of the businesses of these companies are concentrated within the United States of America. This is in addition to other factors that may put pressure on stocks, such as geopolitical tensions.
The markets have reduced their bets on US interest rate cuts, as they are currently pricing in the possibility of a rate cut twice or even once this year after it was priced about seven times at the beginning of this year, contrasting with the expectations of Federal Reserve members or the dot plot that indicated a three-time rate cut.
Technically, the Russell 2000 index reached 2146.6 points on April 1, 2024, its highest level since January 18, 2022, then it fell back and closed yesterday at 1968.5 points. But most importantly of all, it broke the strategic support levels, it fell below the 50-day moving average in blue, which stands at 2045.2 points, and the next challenge lies in reaching the 200-day moving average in yellow, which stands at 1913 points.
As for the analysis of the MACD indicator, we notice a bearish crossover between the blue MACD line and the orange SIGNAL indicator, which indicates negative momentum for the Russell 2000 index.
Please note that this analysis is provided for informational purposes only and should not be considered as investment advice.
Taurex is the trading name of Zenfinex Global Limited, Stochastic Africa SL Ltd, Zenfinex Global LLC, and Zenfinex Limited.
Zenfinex Global Limited is registered in the Republic of Seychelles with registration number: 8428731-1 and is regulated by the Financial Services Authority of Seychelles (license number SD092). Its registered office address is F20, 1st Floor, Eden Plaza, Eden Island, Seychelles.
Stochastic Africa (SL) Limited is a company registered in Sierra Leone with Company Number: SL270319STOCH05271 and is licensed by the Bank of Sierra Leone under license number BSL/SAL/2023 and with the registered office at 148D Wilkinson Road, Freetown, Sierra Leone.
Zenfinex Global LLC is a company registered with the Financial Services Authority in Saint Vincent and the Grenadines under registered number 138 LLC 2019. Its registered office is Hinds Building, Kingstown, Saint Vincent, and the Grenadines.
Zenfinex Limited is a company registered in England and Wales under registered number: 11077380. Authorised and regulated by the Financial Conduct Authority under firm reference number 816055. Its registered office is 4th Floor, 4 Eastcheap, London, EC3M 1AE, United Kingdom.
*All trading involves risk.


