


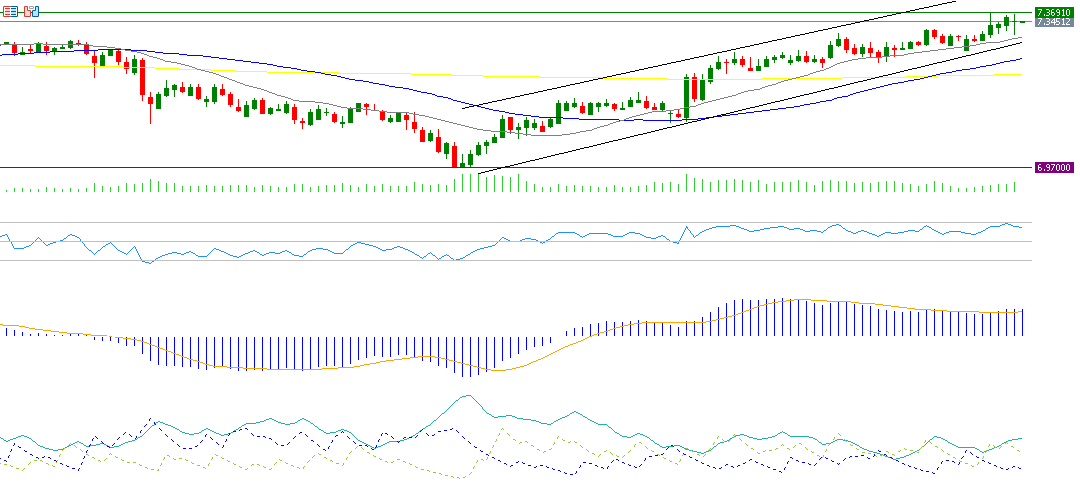
The US dollar against the Chinese yuan closed at 7.3691 at the end of last year, marking its highest level since October 25, 2022, and is currently trading near the 7.3500 levels. The pair of US dollar and Chinese yuan has increased by about 6% since the low of September 27, 2024, when it recorded 6.9691, to the peak it reached at the end of the year, which was 7.3691. It also rose by about 3% in the previous year. As for Chinese markets, the Hang Seng Index rose by about 17%, and the CSI 300 Index rose by about 15% last year. However, the beginning of this year has been negative for both indices.
Despite the government’s stimulus efforts to support the Chinese economy since September of last year, recent Chinese economic data show that the Chinese economy is struggling, reinforcing the need for further intervention by the Chinese authorities to support it. The manufacturing PMI for December declined to 50.1 points, which is lower than expectations and the previous reading (50.3). Additionally, the Caixin manufacturing PMI for December also declined to 50.5 points, which is lower than expectations (51.6) and the previous reading (51.5).
Despite the decline in the aforementioned indicators, the Caixin Services PMI has risen, recording growth of 52.2 points, which is higher than the expectations (51.7) and the previous reading (51.5), reaching its highest level in 7 months. Moreover, the Non-Manufacturing PMI rose to 52.2 points, which is higher than the expectations (50.2) and the previous reading (50.0).
Weak consumption and the troubled real estate sector continue to pose significant challenges for China. The Ministry of Finance in China has pledged to increase spending this year, targeting a growth rate of 5% and a 4% budget deficit relative to GDP. Additionally, expectations have risen regarding a larger interest rate cut this year. Notably, an important factor that has provided upward momentum to the US dollar against the Chinese yuan is the strength of the US dollar, the resilience of the US economy, and the outperformance of most US economic data compared to analysts’ expectations. Furthermore, Trump’s pledge to impose a 60% tariff on Chinese goods has contributed to this momentum.
Goldman Sachs has predicted that the dollar will decline against the yuan to 7.40 in the next three months.
Markets are awaiting, on Thursday, the upcoming consumer and producer price indices in China, with expectations that consumer prices will decrease by 0.1% year-on-year in December, which is lower than the previous reading (0.2%).
It appears that technical indicators may support the US dollar against the Chinese yuan in the coming phase for several reasons:
- MACD Indicator (in blue) has crossed above the Signal Line (in orange), signaling bullish momentum for the US dollar against the Chinese yuan.
- RSI Indicator: Currently at around 65 points, indicating positive momentum for the US dollar against the Chinese yuan.
- DMI+ Indicator: Currently at around 27 points, compared to the DMI- indicator at around 10 points. The significant gap between these two indicators suggests strong buying pressure on the US dollar against the Chinese yuan. More importantly, the ADX Indicator is at around 35 points, suggesting a strong bullish trend momentum.
As for support and resistance levels, if the pivot point of 7.3581 for the dollar against the yuan is broken, there is a possibility that the pair will target support levels at 7.3543, 7.3479, and 7.3441. If the pivot point is surpassed, it is likely that the pair will target resistance levels at 7.3645, 7.3683, and 7.3747.
Please note that this analysis is provided for informational purposes only and should not be considered as investment advice. All trading involves risk.



