
Key Points
- Gold and the S&P 500 spent the second half of 2025 rallying in lockstep, a rare alignment driven by AI optimism, central bank accumulation, and dollar debasement concerns. From July 2025 to January 2026, gold surged roughly 67% while the S&P 500 gained around 25%. Both assets were being bought for different reasons, but moving in the same direction.
- That correlation has now broken. Since the shared correction in early 2026, the S&P 500 has recovered to its highs near 7,500 while gold has continued to slide from 5,200 to 4,125. One of these markets is mispricing the macro environment, and the chart below shows exactly where the split happened.
- The gold daily chart sits on a demand zone between 3,900 and 4,100 with two bull RSI divergences, while the S&P 500 is trading at the same level it hit in January. Historically, when these two assets diverge this sharply, the resolution tends to be violent. Either equities are too optimistic or gold is too pessimistic. VIP readers should be watching for which one blinks first.
Phase 1: The Tandem Rally (July 2025 to January 2026)
From July 2025 through January 2026, gold and the S&P 500 did something unusual. They rallied together.
Look at the left side of the chart. The blue line (S&P 500) climbs steadily from around 6,000 to 7,500 while the gold candlesticks march from approximately 3,100 to above 5,200. Both assets printed higher highs and higher lows in near perfect tandem for six months. On the gold chart, this phase is defined by a series of bullish break of structure confirmations, with each pullback respected and each new high confirmed by momentum.
This kind of synchronised rally is historically rare. Gold and equities have traditionally carried a low or negative correlation because they serve different purposes: equities price growth and earnings, while gold prices fear, inflation, and monetary uncertainty. When they move together, it signals that markets are responding to a single dominant force.
In this case, that force was liquidity. Central banks bought approximately 863 tonnes of gold in 2025, near record levels, while simultaneously, the AI investment cycle was funnelling trillions into equities. Investors were buying the S&P 500 for earnings growth and buying gold to protect against a devaluing currency. Rather than choosing one or the other, institutions chose both. The positive correlation held because neither thesis was being challenged.
Phase 2: The Shared Correction (February to April 2026)
The first cracks appeared in late January 2026. Gold peaked above 5,200, printing a break of structure at the top of the chart, and then reversed sharply. The S&P 500 followed shortly after, selling off from 7,500 to around 6,400 between February and April.
This phase looked normal. Both assets corrected together, which is what you would expect when a liquidity driven rally unwinds. Gold fell from 5,200 to the 4,200 to 4,400 range. The S&P 500 dropped roughly 15% from its highs. The correlation remained positive: both were going down at the same time, for broadly similar reasons. Monetary policy expectations were shifting, the Fed was signalling a more hawkish posture, and the risk on trade was cooling.
If the correction had resolved with both assets recovering together, this chart would tell a straightforward story. But that is not what happened.
Phase 3: The Divergence (April 2026 to Present)
From April 2026 onwards, the blue line and the candlesticks tell completely different stories.
The S&P 500 staged a full recovery. It climbed from 6,400 back to approximately 7,500, reclaiming every point lost in the correction and returning to its January highs. The equity market looked at the macro picture and decided that the risks were manageable: AI earnings were still growing, corporate buybacks were supporting prices, and a hawkish Fed was being interpreted as evidence that the economy was strong enough to handle tighter policy.
Gold did the opposite. Instead of recovering, it continued to slide. From 4,400 in April to 4,125 today, gold has drifted lower through a series of bearish break of structure moves, with a clear change of character at the 4,100 level in May confirming the shift in control from buyers to sellers. The demand zone between 3,900 and 4,100 is now being tested.
This is the divergence that matters. The positive correlation that held for nearly a year has flipped. The S&P 500 is back at its highs and gold is more than 20% off its highs. Two markets looking at the same macro environment are reaching opposite conclusions.
Why It Matters
When gold and equities diverge this sharply, one of them is wrong. The question is which one.
The case for equities being right is straightforward. Corporate earnings, particularly in technology and AI, remain robust. The labour market has cooled but has not collapsed. The Fed is hawkish, but a hawkish Fed in a growing economy is not inherently bearish for stocks. The S&P 500’s recovery to 7,500 reflects a market that believes the economy can absorb higher rates without tipping into recession.
The case for gold being right is more nuanced. Central bank buying has slowed: while institutions purchased 863 tonnes in 2025, the pace moderated as prices rose above 4,000. Higher real yields make gold less attractive relative to interest bearing assets. And a Fed that is raising rather than cutting rates removes one of gold’s primary tailwinds. If you take the equity market at face value and accept that the economy is strong, then gold’s decline is rational.
But there is a third possibility, and this is the one VIP readers should watch most closely. The divergence may be telling us that the equity rally is running on narrative rather than fundamentals, and that gold is pricing in a risk that equities have not yet acknowledged. The two bull RSI divergences at the bottom of the gold chart suggest that the selling pressure is fading even as price makes new lows. Managed money remains net long 120,091 contracts, which sits at the 56th percentile of its 52 week range: hardly panic territory. Institutions are not fleeing gold. They are repositioning.
Historically, sharp divergences between gold and equities have resolved with a violent move in one direction. In 2018, the S&P 500 ignored gold’s warning and then crashed 20% in Q4. In 2020, both assets rallied together before the pandemic, and gold’s breakout above 2,000 correctly signalled the monetary policy response that followed. The divergence does not tell you which asset is right. It tells you that the current equilibrium is unstable and that a significant repricing is coming.
The Chart
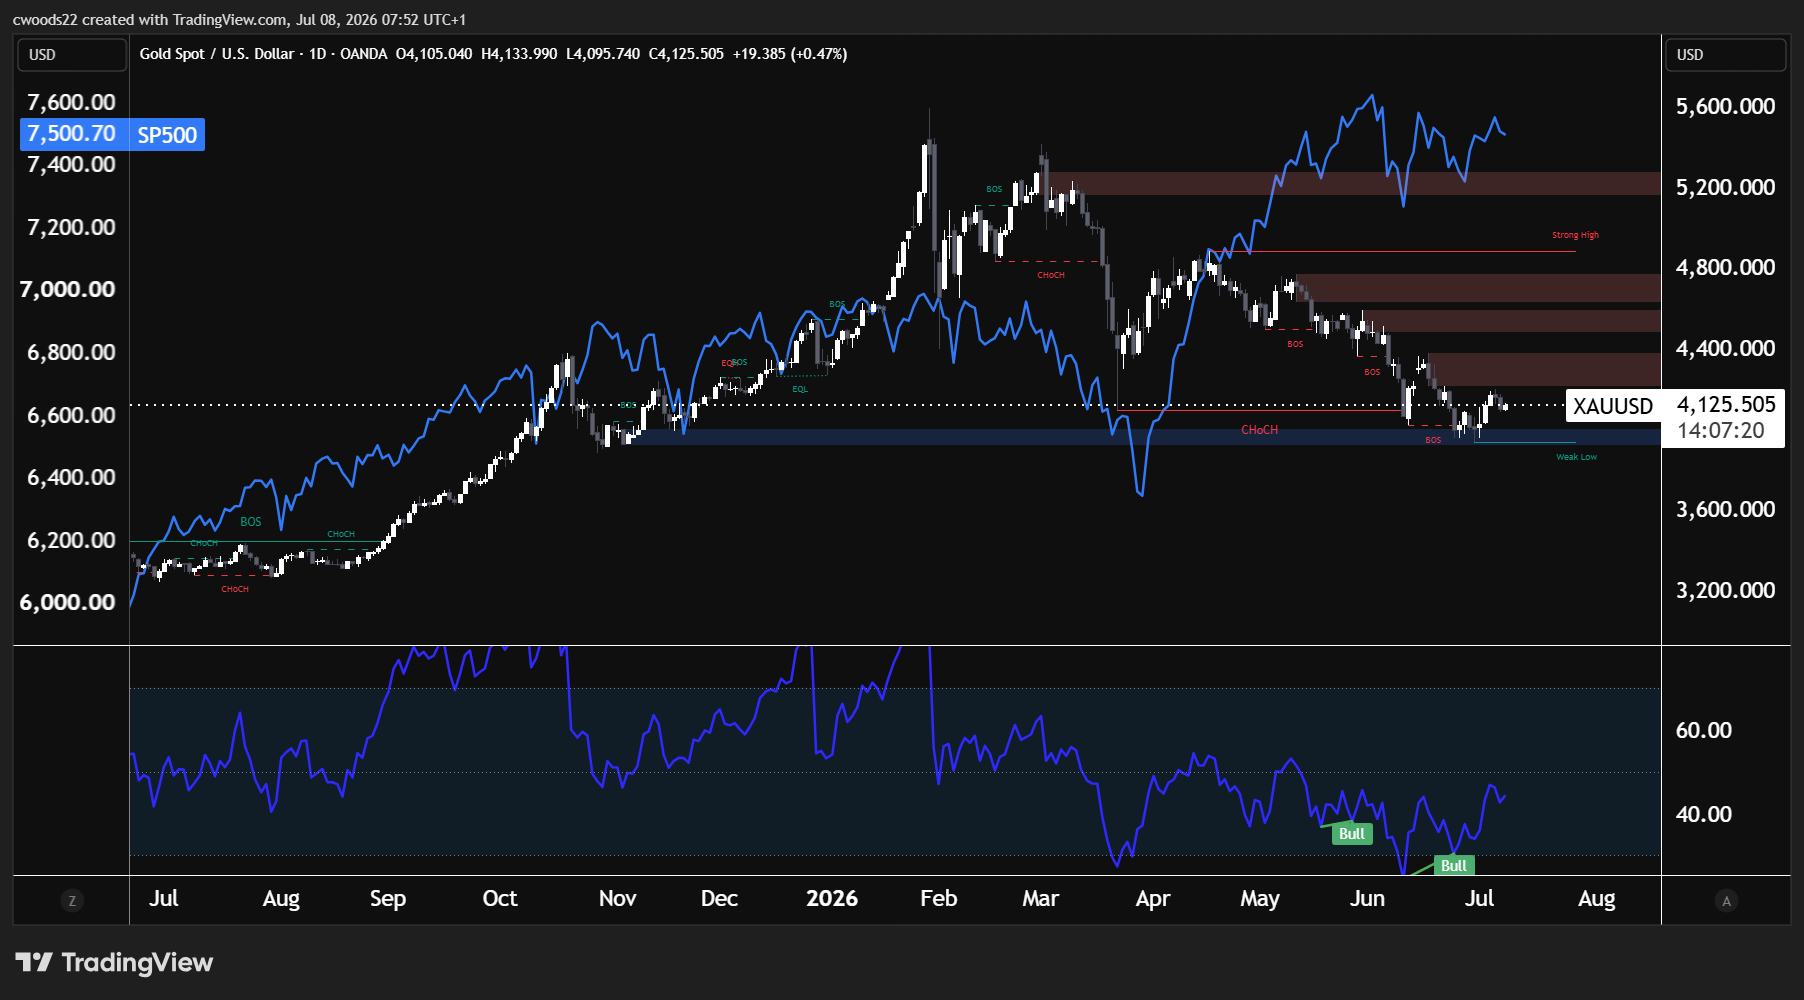
Chart: Gold (XAUUSD) Daily with S&P 500 overlay (TradingView, SMC)
The daily chart shows gold at 4,125, sitting just above the demand zone between 3,900 and 4,100 (the blue shaded area). The structure has been bearish since the break of structure at the high above 5,200 in early 2026, with price making lower highs and lower lows through multiple change of character signals on the way down.
The two bull RSI divergences at the June and July lows are the most important signal on this chart. Price made lower lows while RSI printed higher lows, which historically precedes either a bounce or a full trend reversal. This is the same divergence pattern that appeared at the bottom in July 2025 before gold began its rally from 3,100.
The key levels are clear. The high near 4,800 to 5,000 represents the level that needs to break for the long term bullish trend to resume. The demand zone between 3,900 and 4,100 is the structural floor. A break below 3,900 would open a move toward 3,600 and would confirm that the divergence from equities was justified. A bounce from demand that reclaims the change of character at 4,100 to 4,200 would be the first sign that gold is preparing to close the gap with the S&P 500.
For VIP readers, the trade is not about picking a direction today. It is about recognising that this level of divergence between two of the world’s most watched assets does not persist. The resolution will create opportunities, and the RSI divergence on gold suggests that the rebalancing may begin from the gold side first.
View our economic insights for the latest cross-asset analysis and market intelligence.
Risk Warning: Trading financial instruments, particularly those involving leverage, involves a substantial degree of risk and is not appropriate for all investors. The value of your investments can rise or fall sharply, and it is possible to lose the entirety of your invested capital. Do not trade with funds you cannot afford to lose. Nothing in this site should be read or construed as constituting advice on the part of Taurex or any of its affiliates, directors, officers or employees.