
Key Points
- USD/JPY has rallied from the 156.50 strong low through consecutive breaks of structure and is now pressing against the weak high at 160.00. The structure on the H1 is textbook bullish, with demand zones at 159.00 and 157.00 providing the floor. Friday’s weak US retail sales data and collapsing consumer sentiment have not dented the yen carry trade unwind, with the pair still driven by the 450 basis point rate differential between the Fed and the Bank of Japan. A pullback into the 159.00 to 159.20 demand zone could offer the entry for the next leg toward 160.00 and beyond.
- The DAX has rallied from 25,500 to tag the strong high at 26,600, but three bear RSI divergences on the H1 chart are warning that momentum is fading. A bearish change of character has confirmed the short term shift, and price has pulled back to 26,238. The supply zone between 26,350 and 26,450 is where sellers could step back in on any bounce, with the demand zone at 26,050 to 26,200 as the downside target.
- Bitcoin has recovered from its August 13 lows after a bull RSI divergence sparked a structural reversal. The H1 chart shows consecutive breaks of structure on the way up from 63,000 to 64,151, but five bear RSI divergences overhead remind traders that the broader range between 62,500 and 65,500 remains intact. A pullback into the 63,000 to 63,300 demand area could offer the entry for the next push toward the 64,800 to 65,200 supply zone.
Trade 1: USD/JPY Long from Demand
| Pair | Direction | Entry Zone | Target 1 | Target 2 | Invalidation |
| USD/JPY | Long | 159.00 to 159.20 | 160.00 | 160.50 | Below 158.00 |
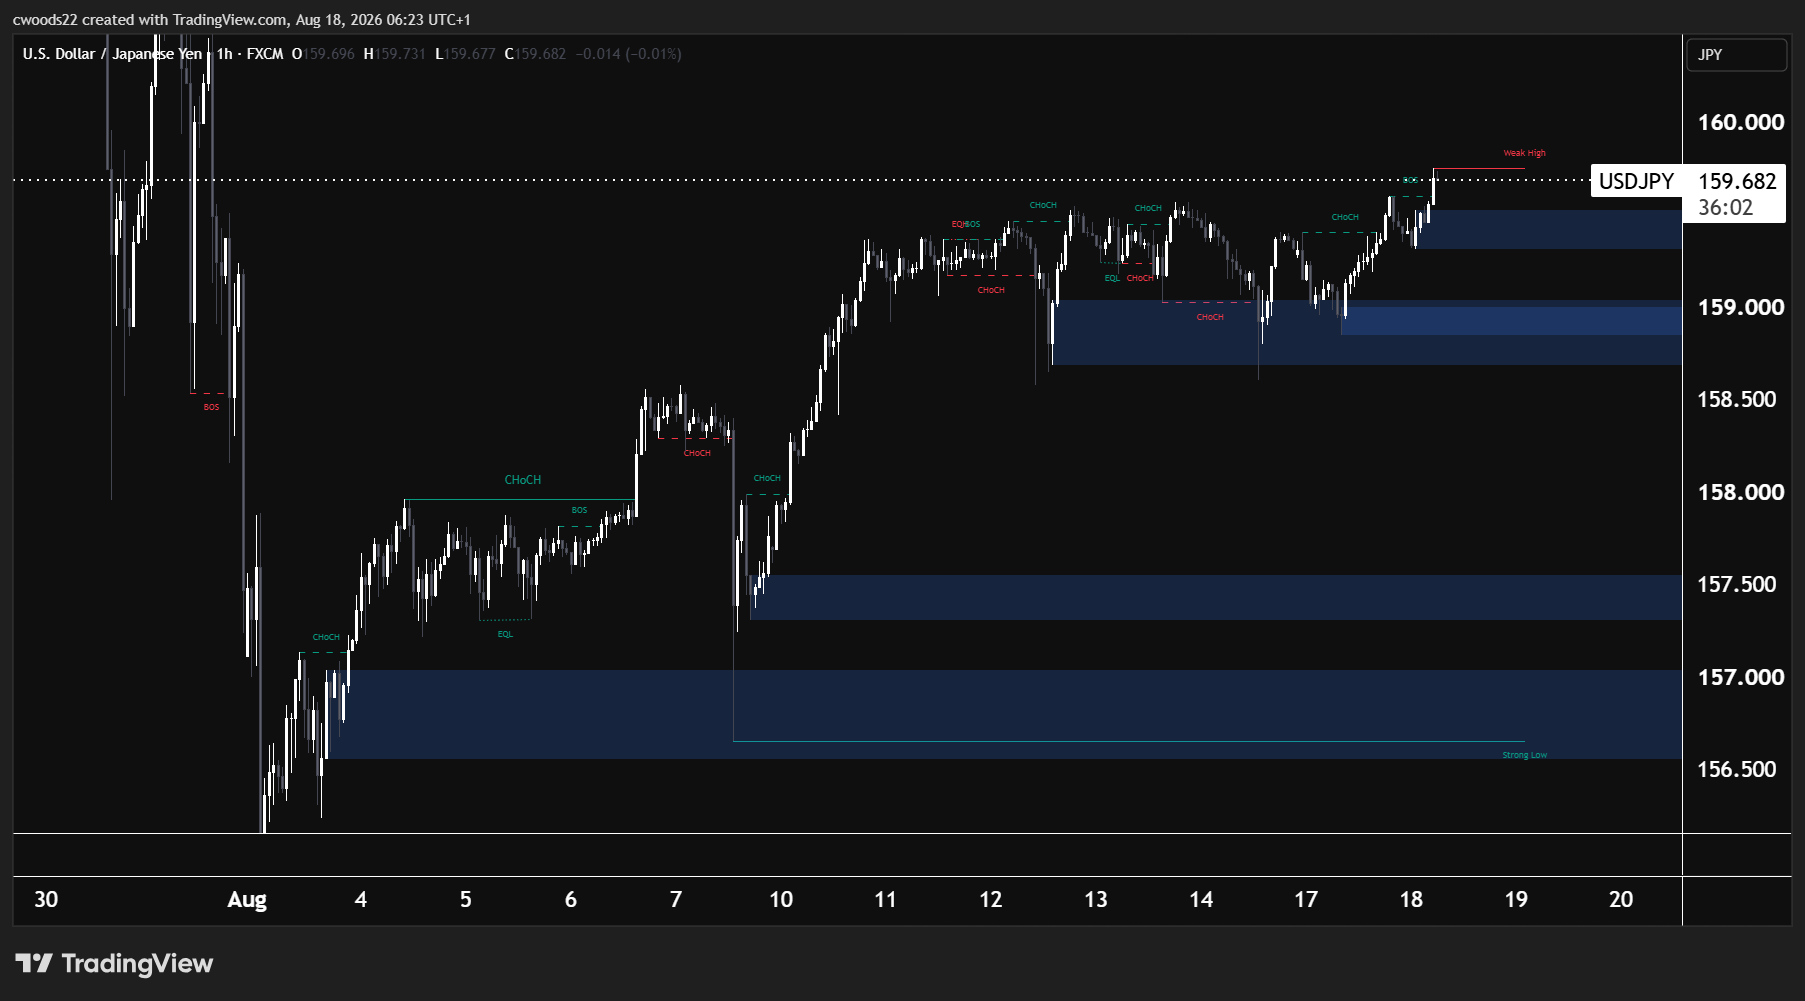
Chart: USD/JPY, H1 timeframe (TradingView, SMC)
USD/JPY is the cleanest trending pair on the board right now. The H1 chart shows a rally from the 156.50 strong low through a sequence of bullish changes of character and breaks of structure, with price now sitting at 159.68, just 30 pips from the weak high at 160.00. Every structural pullback has been met with demand, and the buyers have defended each level methodically.
The fundamental backdrop supports the move. The Bank of Japan remains anchored at near zero interest rates while the Fed holds at 3.50% to 3.75%, creating a carry trade differential that continues to attract capital. Friday’s weak US data (retail sales at negative 0.6%, consumer sentiment at 51.0) briefly weakened the dollar across the board, but USD/JPY barely flinched because the yen is equally pressured by Japan’s dovish monetary stance. The Nikkei’s 2.92% gain over the past five days further reflects the weak yen tailwind for Japanese equities.
The trade looks for a pullback into the 159.00 to 159.20 demand zone, where a cluster of changes of character and equal lows provide structural support. Target 1 is the 160.00 weak high, a psychologically significant level that will attract attention from both retail and institutional participants. Target 2 sits at 160.50, the next clean area above the weak high. Invalidation sits below 158.00, where a break would suggest a deeper correction toward the 157.00 demand zone.
The key risk is any surprise from the FOMC minutes on Wednesday. If the minutes reveal that the hawks are losing ground, the dollar could sell off more broadly and drag USD/JPY with it. However, as long as the rate differential persists, dips are likely to be bought.
Trade 2: DAX (GER40) Short from Divergence
| Pair | Direction | Entry Zone | Target 1 | Target 2 | Invalidation |
| GER40 | Short | 26,350 to 26,450 | 26,100 | 26,000 | Above 26,600 |
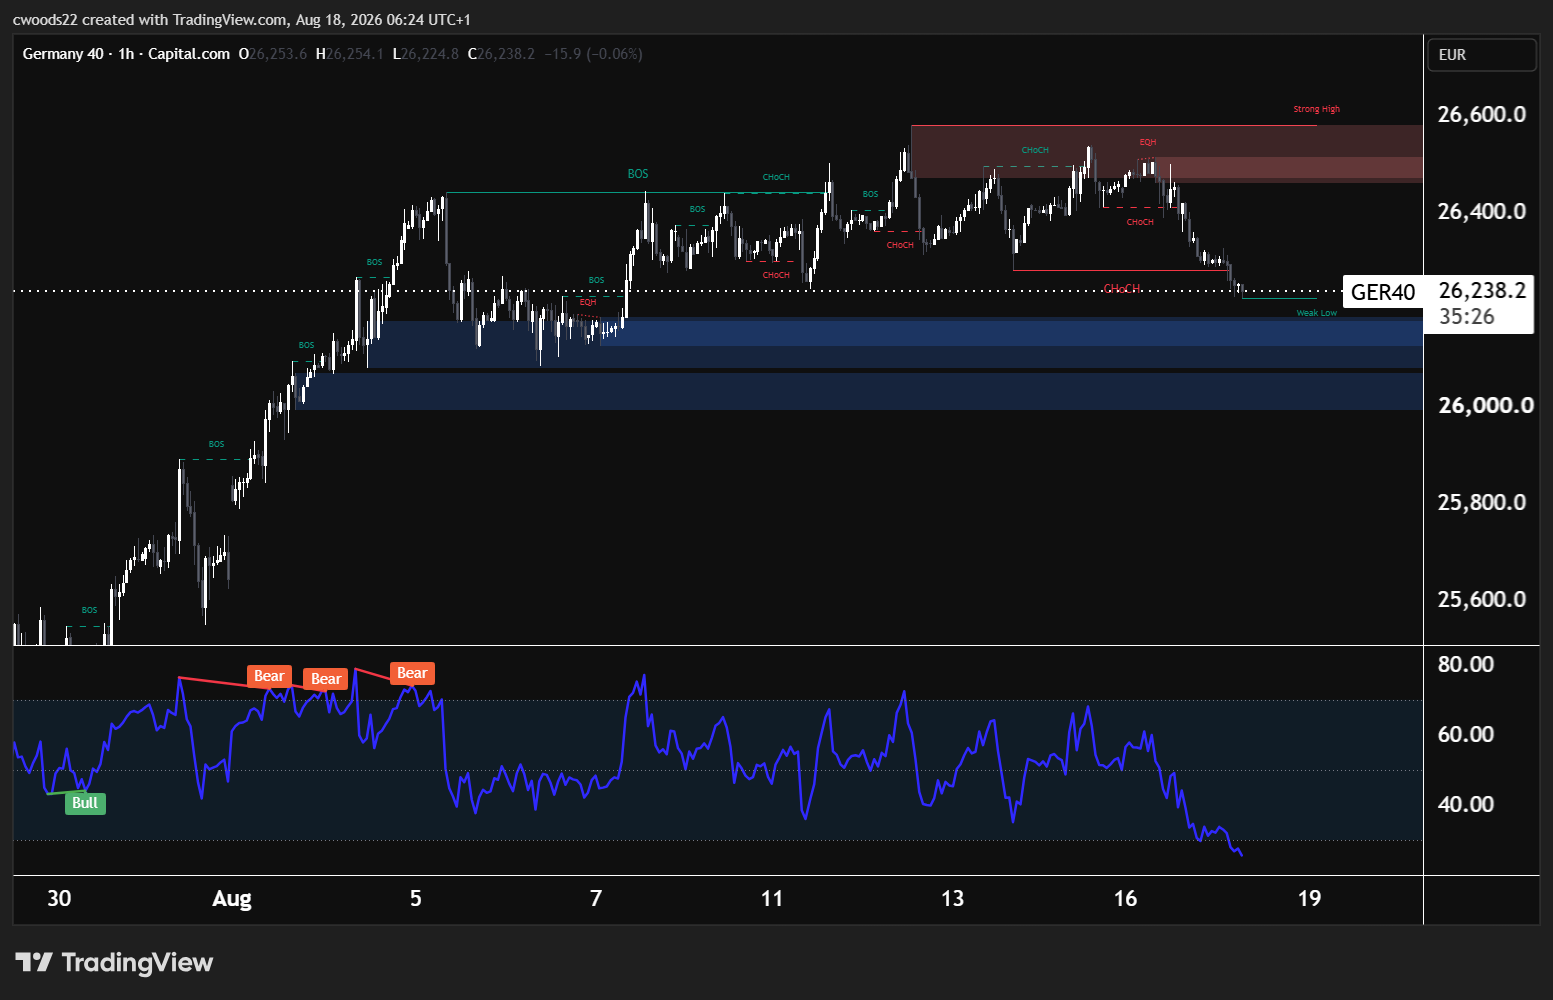
Chart: DAX (GER40), H1 timeframe (TradingView, SMC)
The DAX has had an impressive run from 25,500 to 26,600 over the past three weeks, but the RSI is telling a different story. Three bear divergences have formed during the rally, each one with price making a higher high while the RSI prints a lower high. This pattern has preceded pullbacks repeatedly throughout 2026, and the latest bearish change of character near 26,400 confirms that short term momentum has shifted.
The strong high at 26,600 is the structural ceiling. This level held on the first test, and price has since pulled back to 26,238 with the equal highs (EQH) around 26,500 having already been swept for liquidity. The fact that the EQH were taken and price failed to hold above them is a classic Smart Money signal that institutional sellers used the liquidity above the equal highs to distribute.
The trade looks for a retest of the 26,350 to 26,450 supply zone on any bounce, with Target 1 at the 26,100 demand zone and Target 2 at the 26,000 psychological level. Invalidation sits above the strong high at 26,600, where a break would signal that the rally has resumed and the divergences have been absorbed.
Rising oil prices from the Hormuz stalemate are a headwind for European equities, particularly energy intensive German manufacturers. The ECB’s Lagarde is scheduled to speak on Wednesday, and any dovish signals could provide a temporary bid, but the technical picture favours the bears while the divergences are active. German ZEW economic sentiment data is also due today, with expectations for a modest improvement from 26.3 to 30.0.
Trade 3: Bitcoin Long from the Bull Divergence
| Pair | Direction | Entry Zone | Target 1 | Target 2 | Invalidation |
| BTC/USD | Long | $63,000 to $63,300 | $64,800 | $65,200 | Below $62,500 |
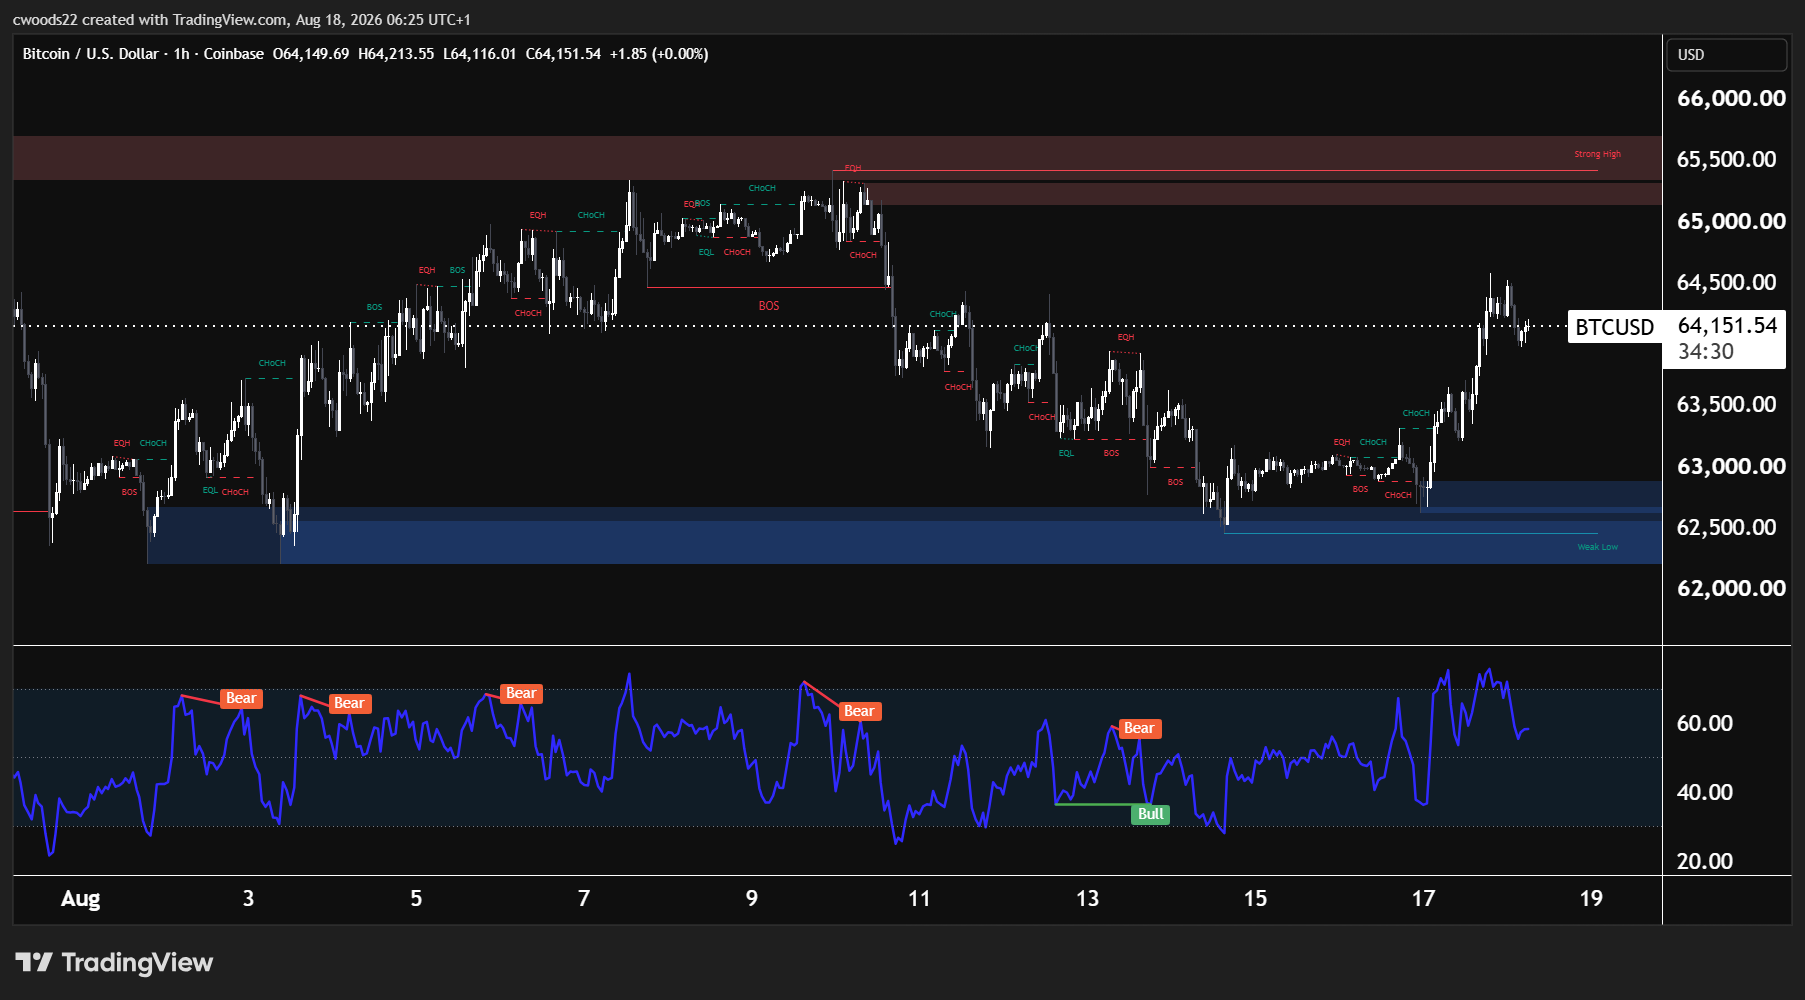
Chart: BTC/USD, H1 timeframe (TradingView, SMC)
Bitcoin has been trapped in a range between 62,500 and 65,500 for most of August, and the H1 chart reveals a market that is being driven by divergence signals at both extremes. Five bear RSI divergences formed during the initial rally and subsequent retests of the highs, each one warning that buying pressure was fading. The most recent sell off from 65,000 to 63,000 was the result.
At the August 13 lows, a bull RSI divergence formed with price printing lower lows while RSI printed higher lows, signalling that selling momentum had exhausted. The recovery has been constructive, with consecutive breaks of structure and changes of character confirming a bullish shift on the H1 timeframe. Price is now at 64,151, roughly mid range.
The trade looks for a pullback into the 63,000 to 63,300 area, where the equal lows (EQL) and the structural break zone provide demand. This is where the bull divergence was confirmed, making it the strongest demand area on the H1 chart. Target 1 is the 64,800 level where the supply zone begins, and Target 2 is 65,200 where the equal highs (EQH) sit as a liquidity target. Invalidation sits below the weak low at 62,500, where a break would confirm a shift in the broader structure.
Bitcoin’s correlation with risk assets remains elevated, so the FOMC minutes on Wednesday could be the swing factor. A dovish read would likely support crypto alongside equities, while a hawkish surprise would pressure the entire risk complex.
Risk Warning: Trading financial instruments, particularly those involving leverage, involves a substantial degree of risk and is not appropriate for all investors. The value of your investments can rise or fall sharply, and it is possible to lose the entirety of your invested capital. Leveraged products, in particular, amplify both potential gains and losses. Before engaging in such trading, you must assess your financial goals, experience level, and appetite for risk. It is your sole responsibility to ensure that you understand the mechanics and risks of trading, including margin requirements, and to seek independent financial advice where appropriate. Do not trade with funds you cannot afford to lose. Nothing in this site should be read or construed as constituting advice on the part of Taurex or any of its affiliates, directors, officers or employees.