Key Points
- Copper is trading at 6.6168, about 4% below its late-September record near 6.92, after rising close to 60% from the August 2025 low near 4.34, and the daily chart shows a market consolidating under its highs rather than breaking down.
- The bull case rests on supply that cannot respond quickly: global mine output fell 1.1% in the first half of 2026, Codelco’s output fell 11%, and the IEA expects falling ore grades, long project lead times and rising costs to leave a supply gap of 25% to 30% by 2035, just as AI data centres and grid build-out lift demand.
- The bear case is just as real, with the ICSG forecasting a refined surplus of 104,000 tonnes in 2026 and 368,000 in 2027, COMEX stockpiles at a record 711,609 tonnes, and a pending US tariff decision keeping the gap between COMEX and LME prices in play.
The Rally and the Squeeze Behind It
LME copper rose nearly 40% in 2025, its biggest annual gain since 2009, passed $12,000 a tonne in December and briefly exceeded $14,500 in January 2026. The daily COMEX chart tells the same story in dollars per pound, with price climbing from a low near 4.34 in August 2025, after the tariff-driven spike and collapse of that summer, to a record near 6.92 in late September.
The reason the move has been so persistent is supply. The ICSG reports that global mine output fell 1.1% in the first half of 2026 and concentrate output fell 2.6%. Codelco produced 564,000 tonnes in the half, down 11% from 634,000, mainly because of operating restrictions at El Teniente, where a landslide has killed two workers and halted part of the operation, and the Centinela mine has been on strike since 7 October. The Escondida strike was averted on 14 October when supervisors approved a new 36-month contract.
Why Supply Cannot Catch Up
Copper is hard to produce more of. The IEA says average ore grades have fallen 40% since 1991, the capital intensity of expanding existing projects has risen 65% since 2020, and a new mine takes around 17 years on average to go from discovery to production. Only 5% of the deposits found over the last 35 years were discovered in the last decade, so high prices cannot quickly create new supply.
Even refining is strained. The annual benchmark treatment charge for smelters settled at zero in January 2026, the lowest ever agreed, a sign that concentrate is scarce, and China’s top smelters have agreed to cut output by more than 10% this year. It also links copper to the metals in the last edition: silver is mostly a by-product of copper mining, and record gold, silver and sulphuric acid prices are currently cushioning smelter profits.
Demand and the Tariff Question
The IEA expects global data centre electricity use to reach about 945 TWh by 2030, roughly double 2024. BHP estimates that each extra $200 billion of annual data centre investment could require copper equivalent to a new 150,000 tonne a year mine, and expects data centre copper demand to rise about sixfold from 2024 to 2050, to around 3 million tonnes a year. This week Anglo American’s chief executive Duncan Wanblad said the company has held talks with technology firms about taking equity or securing supply for data centres, though no stakes have been taken yet.
The counterweight is a market that is not obviously short of metal today. The ICSG forecasts a refined surplus of 104,000 tonnes in 2026, widening to 368,000 in 2027, and COMEX stocks sit at a record 711,609 tonnes against 233,025 on the LME, a legacy of metal pulled into the US ahead of a possible tariff. A phased tariff on refined copper, 15% in 2027 and 30% in 2028, is still awaiting a presidential decision, and the gap between COMEX and LME prices has narrowed to about $135 a tonne from about $420 at the end of July. Goldman Sachs’ June forecast of $13,735 a tonne for end-2026 sits below today’s price.
Technical Setup
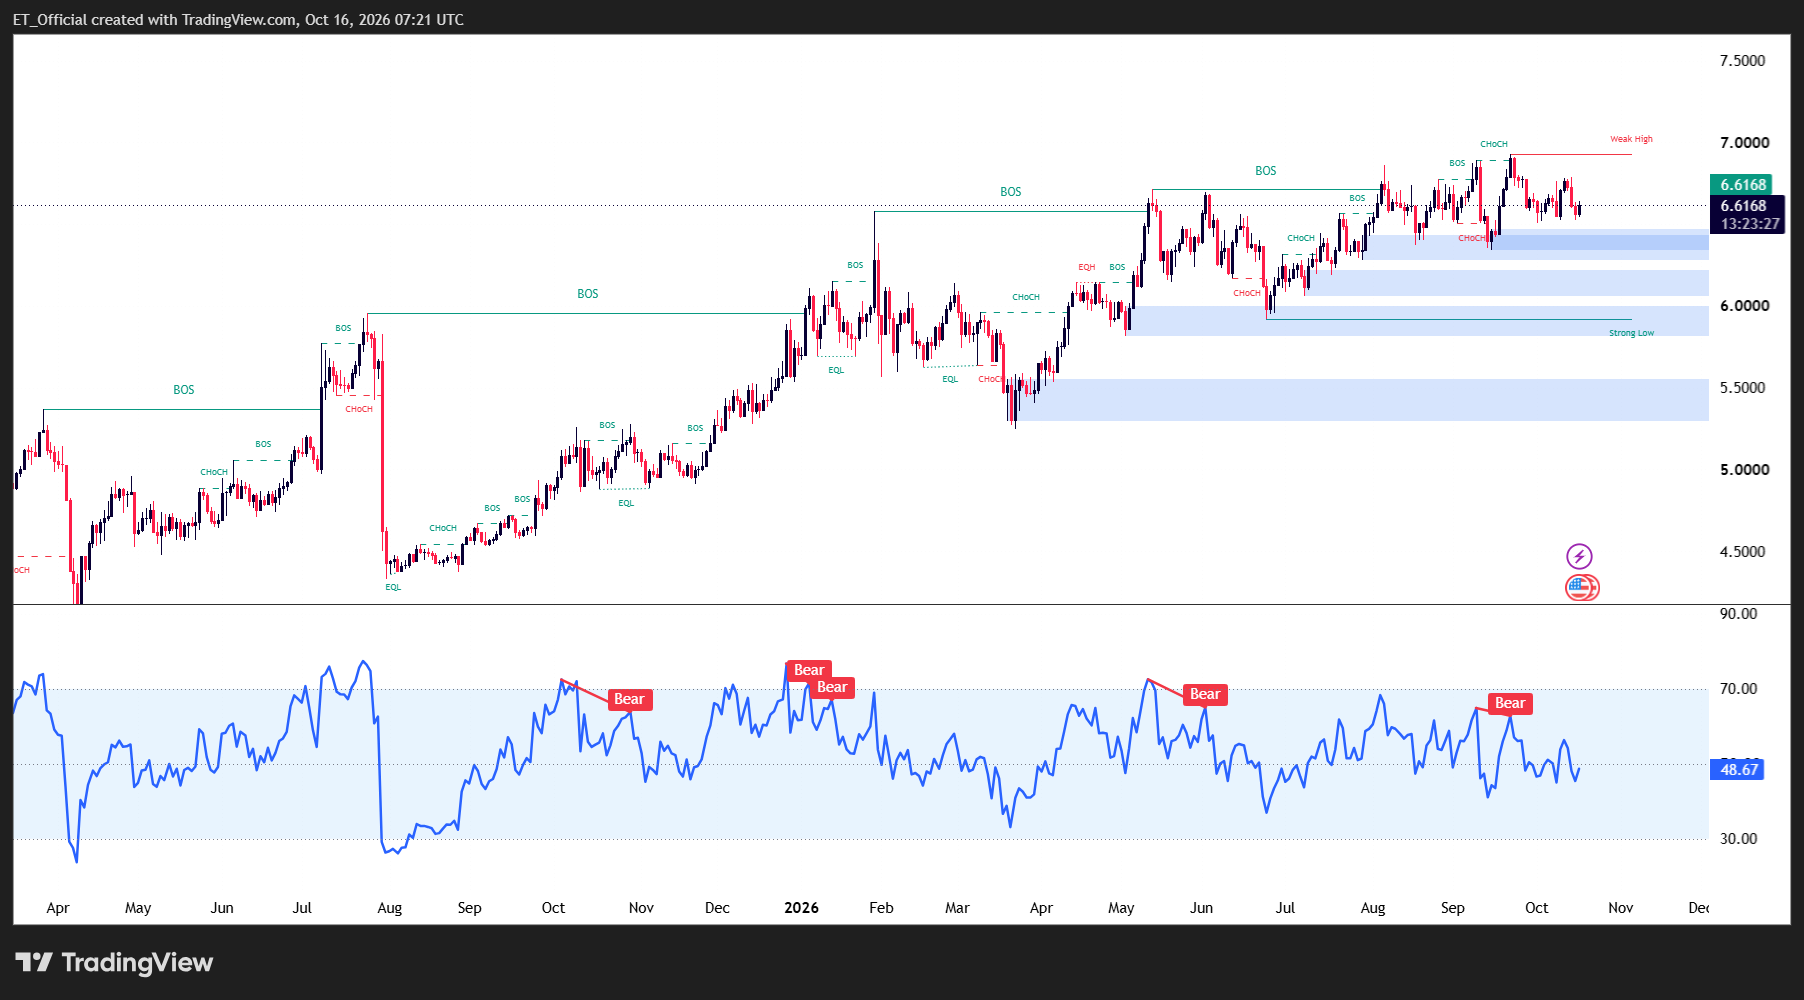
Chart: COMEX Copper (HG, USD per pound) with RSI, Daily timeframe (TradingView, SMC)
Copper (HG) daily chart with RSI, April 2025 to 16 October 2026: price rose from a low near 4.34 in August 2025 to a record near 6.92 in late September 2026 through a series of higher lows, and is now trading at 6.6168 above demand zones at 6.28 to 6.47 and 6.05 to 6.21, with RSI at 48.67 after four bearish divergences.
The Chart: Higher Lows, Fading Momentum
The daily chart shows a staircase of higher lows after the August 2025 low near 4.34, at about 5.27 in March, 5.91 in June and 6.35 in September, while the highs stepped up from about 6.6 in January to 6.68 in May and the record near 6.92 in late September. Each correction has been shallower than the last: about 20% from January to March, about 11% from May to June, and about 4% so far from the September high.
Momentum is the caution. RSI sits at 48.67, neutral, and it has printed bearish divergence four times since October 2025, including at the September record, with price making higher highs while RSI made lower ones. Divergence preceded the January and May pullbacks, but it is a warning rather than a signal, and the latest one has so far produced only a modest pullback while CPI and a stronger dollar pressed copper lower for three sessions.
The read-through is that this is a consolidation, not a breakdown. The 6.92 high is the level to reclaim for the trend to be back in control, while the nearest demand sits at 6.28 to 6.47, then 6.05 to 6.21 and 5.82 to 5.99 above the June low at 5.91. A daily close below 6.28 would break the September low and open the next zone down, with the Fed’s 28 October decision and the unannounced tariff ruling the likely catalysts.
Risk Warning: Trading financial instruments, particularly those involving leverage, involves a substantial degree of risk and is not appropriate for all investors. The value of your investments can rise or fall sharply, and it is possible to lose the entirety of your invested capital. Before engaging in such trading, you must assess your financial goals, experience level, and appetite for risk. It is your sole responsibility to ensure that you understand the mechanics and risks of trading, including margin requirements, and to seek independent financial advice where appropriate. Do not trade with funds you cannot afford to lose. Nothing in this site should be read or construed as constituting advice on the part of Taurex or any of its affiliates, directors, officers or employees.