
Key Points
- Ethereum is trading at $2,421, about 51% below its August 2025 record near $4,946, and has become the market’s forgotten major: on 1 November it traded just $4.6 billion in volume against $66 billion for Bitcoin, its quietest day in three months.
- The neglect shows in the flows: Ether ETPs lost more than $1.6 billion in October, ETH fell 16.5% in the month against 7.6% for Bitcoin, and the Glamsterdam upgrade has been postponed, so attention has moved elsewhere.
- That is exactly why it deserves a closer look. The ETH/BTC ratio broke a falling trendline on 3 November after a 90-day low of 0.0289, ETH outpaced Bitcoin on the midterm rally, and the daily chart has rebounded from $2,178 straight into the supply zone that decides the next move.
The Forgotten Major
Every crypto headline this week has been about Bitcoin reclaiming $80,000 after the US midterms and the fallout from the Binance security breach. Ethereum, the second-largest cryptocurrency with a market value of around $275 billion, has barely featured, and the data shows how far interest has drained away.
On Sunday 1 November, ETH traded $4.63 billion in volume, down 76% from $19.53 billion the day before and the lowest daily figure since mid-August. Bitcoin traded about $65.9 billion on the same day. Measured against market value, ETH turned over 1.68% of its capitalisation against 4.22% for Bitcoin. Fewer traders are watching, and fewer are taking positions.
Why the Market Lost Interest
October was a bruising month. ETH fell 16.5%, from $2,685 to $2,243, more than double Bitcoin’s 7.6% decline, and slipped below its 200-day moving average on 26 October. Spot Ether ETPs recorded more than $1.6 billion of net outflows in the month, and the selling has continued into November, with US spot Ethereum ETFs losing $139.7 million on 2 November, almost all of it from BlackRock’s ETHA.
The fundamental story also lost momentum. Glamsterdam, the network upgrade the market had been looking to as the next catalyst, was reported as postponed on 31 October, and the attack on a major trading venue on 29 October is still slowing withdrawals. With the staking yield at around 2.63% a year, there has been little to pull new money in while Bitcoin absorbs the institutional attention.
Why It Deserves Attention Now
The first sign of a turn is in the relative price. The ETH/BTC ratio, which measures Ethereum against Bitcoin, fell to a 90-day low of 0.0289 on 30 October and then broke above a descending trendline on 3 November. When the midterm results came through, ETH rose 5.8% against Bitcoin’s 3.8%, lifting the ratio to around 0.0301. A market that has been underperforming for months does not usually lead on a risk-on day unless sellers are running out.
The second is policy. The CLARITY Act, the US crypto market-structure bill, needs to pass before the new Congress is seated on 3 January or it has to start again. Clearer rules on how tokens are classified and traded matter more for Ethereum, where most decentralised finance and token issuance sits, than for Bitcoin, so the next eight weeks of headlines from Washington are a direct catalyst.
The third is positioning. The Crypto Fear & Greed Index sits at 34, in fear, and the long/short ratio dropped from 2.78 to 1.61 in a day. Combined with ETF outflows and record-low attention, that describes a market where expectations are already low, which is often where the better risk/reward sits for traders who are paying attention.
Technical Setup
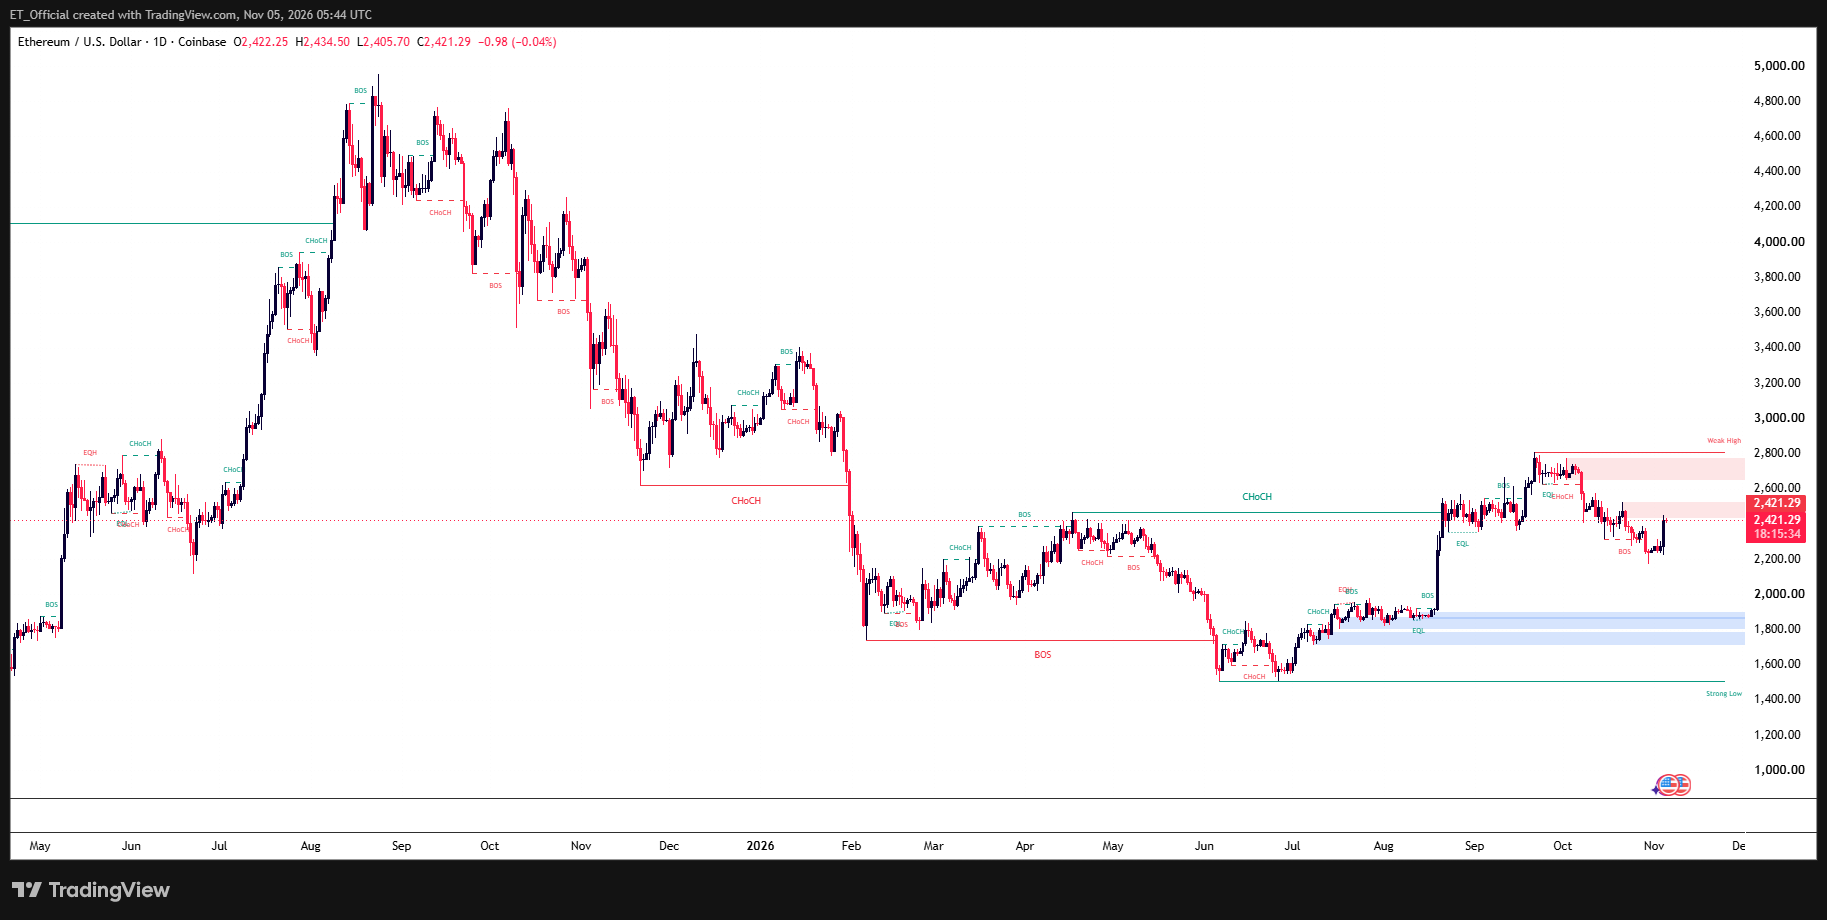
Chart: Ethereum (ETH/USD, Coinbase), Daily timeframe (TradingView, SMC)
Ethereum (ETH/USD) daily chart, May 2025 to 5 November 2026: price fell from a record near $4,950 in August 2025 to a low just above $1,500 in June 2026, broke above the April high near $2,430 in late August, topped near $2,800 in late September, and has rebounded from $2,178 to $2,421 into supply at $2,420 to $2,510.
The Chart: Back at the Breakout Level
The daily chart shows the full cycle. After the record near $4,950 in August 2025, ETH made a series of lower highs and broke structure in February, when price lost the November low near $2,620 and dropped towards $1,750. A range between roughly $1,800 and $2,430 followed into May, before a final break of structure in June took price to the low just above $1,500.
The recovery began with a bullish change of character in July, a base built in August with equal lows around $1,850 to $1,900, and then the key candle of the year: the late-August surge that broke above the April high near $2,430, marked as a change of character on the chart. That move carried price to the high near $2,800 in late September, before a bearish change of character in early October started the pullback that took ETH down to $2,178.
This week’s rebound has brought price straight back to $2,421, which sits on the old April high and at the bottom of the supply zone between $2,420 and $2,510. This is the level that matters. A daily close above $2,510 would reclaim the area where the October sell-off began and open the next supply between $2,640 and $2,760, then the September high near $2,800. A rejection here would keep the October downtrend intact, with $2,178 the first level to watch and the demand zones at $1,800 to $1,890 and $1,700 to $1,780 below.
With the ETH/BTC breakout, the CLARITY Act deadline and Friday’s US payrolls all landing in the coming weeks, the question for traders is whether the market’s most ignored major is quietly turning while everyone is looking at Bitcoin.
Risk Warning: Trading financial instruments, particularly those involving leverage, involves a substantial degree of risk and is not appropriate for all investors. The value of your investments can rise or fall sharply, and it is possible to lose the entirety of your invested capital. Before engaging in such trading, you must assess your financial goals, experience level, and appetite for risk. It is your sole responsibility to ensure that you understand the mechanics and risks of trading, including margin requirements, and to seek independent financial advice where appropriate. Do not trade with funds you cannot afford to lose. Nothing in this site should be read or construed as constituting advice on the part of Taurex or any of its affiliates, directors, officers or employees.