Key Points
- Nvidia reports after the US close today, with US retail sales at 13:30 UTC and Waller at 14:10 UTC, after a Monday selloff that took the S&P 500 down 1.9% and the Nasdaq down 2.5%. The dollar index is at its highest since April 2025, with a December Fed hike priced at about 90%.
- Nvidia is trading at 142.14 euros, about 156 dollars, just above a 139 to 142 demand zone and about 35% below its October peak, with results due at about 21:20 UTC.
- Gold is trading at 3,883.52 after a low near 3,832 on Monday, retesting the 3,877 to 3,900 supply zone after breaking a descending trendline on the 1H chart.
- EUR/USD is at 1.1006, its weakest in about 19 months, with RSI at 28.77 in oversold territory and 1.1220 to 1.1270 the nearest supply above.
Nvidia (NVDA): Last Demand Zone Before Earnings
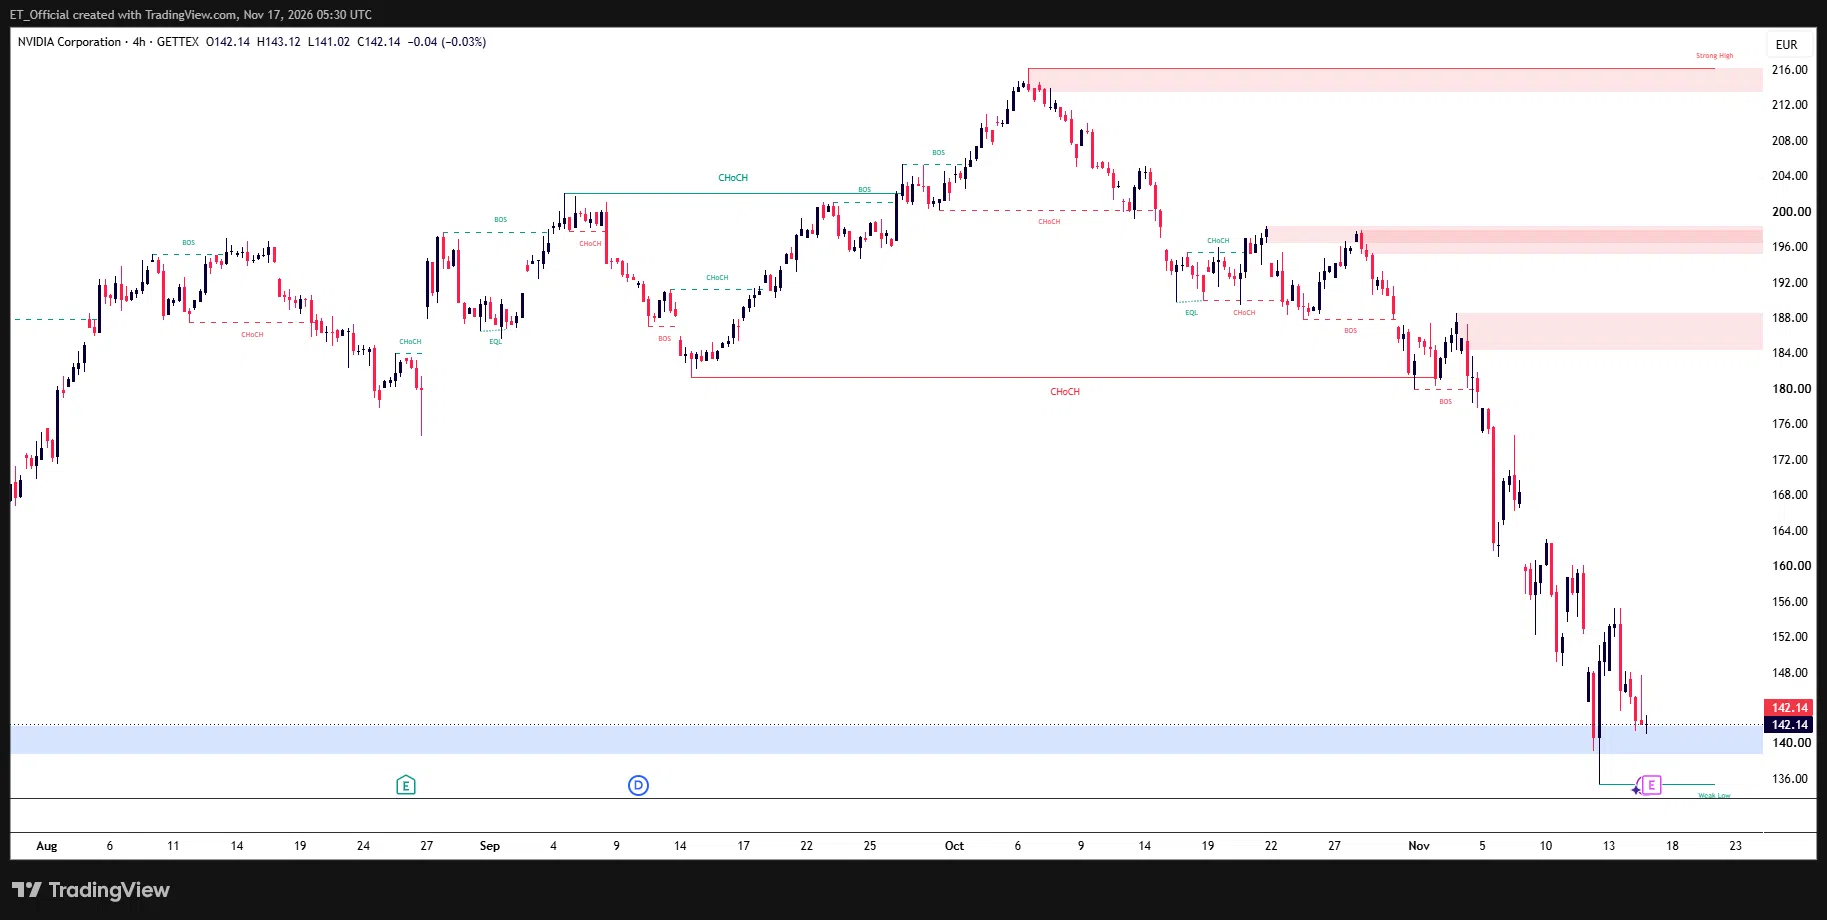
Chart: NVIDIA (NVDA, GETTEX in euros), 4H timeframe (TradingView, SMC)
NVIDIA (NVDA, GETTEX, in euros) 4H chart, 1 August to 17 November 2026: price fell from a high near 216 on 6 October through a break of the 181 change of character level to a low near 135 on 12 November, and is trading at 142.14 just above the 139 to 142 demand zone.
The 4H chart shows a peak near 216 on 6 October, where a supply zone at 213.50 to 216.30 rejected price, followed by lower highs into the 196 to 198.50 and 184.50 to 188.50 supply zones. Price broke the 181 change of character level at the start of November and has fallen in a near-straight line to a low near 135 on 12 November, the day Jensen Huang resigned as CEO.
Price is at 142.14, just above a demand zone at 139 to 142, after a bounce to about 155 on 13 November faded. On the US listing Nvidia closed Monday at 156.14 dollars, down 4.1% and about 35% below its 239.24 closing peak, as chip stocks sold off, with AMD down 5.6% and Micron down 7.6%. Reports cited a weekend note from SemiAnalysis cutting AI accelerator spending forecasts, and Treasury Secretary Bessent reportedly pressing for a shake-up at Nvidia.
Nvidia reports at about 21:20 UTC with the call at 22:00 UTC, its first results under interim CEO Colette Kress. It guided revenue of 108 billion dollars, plus or minus 2%, and consensus is near 111 billion and 2.5 dollars a share, with options implying a move of about 10% either way as of 10 November. A hold of the 139 to 142 zone keeps the bounce idea alive toward 155, while a break below 135 would mean no marked demand on the chart beneath it. Prices here are in euros, so the US listing will move with EUR/USD as well.
Gold: Retesting Supply After a New Low
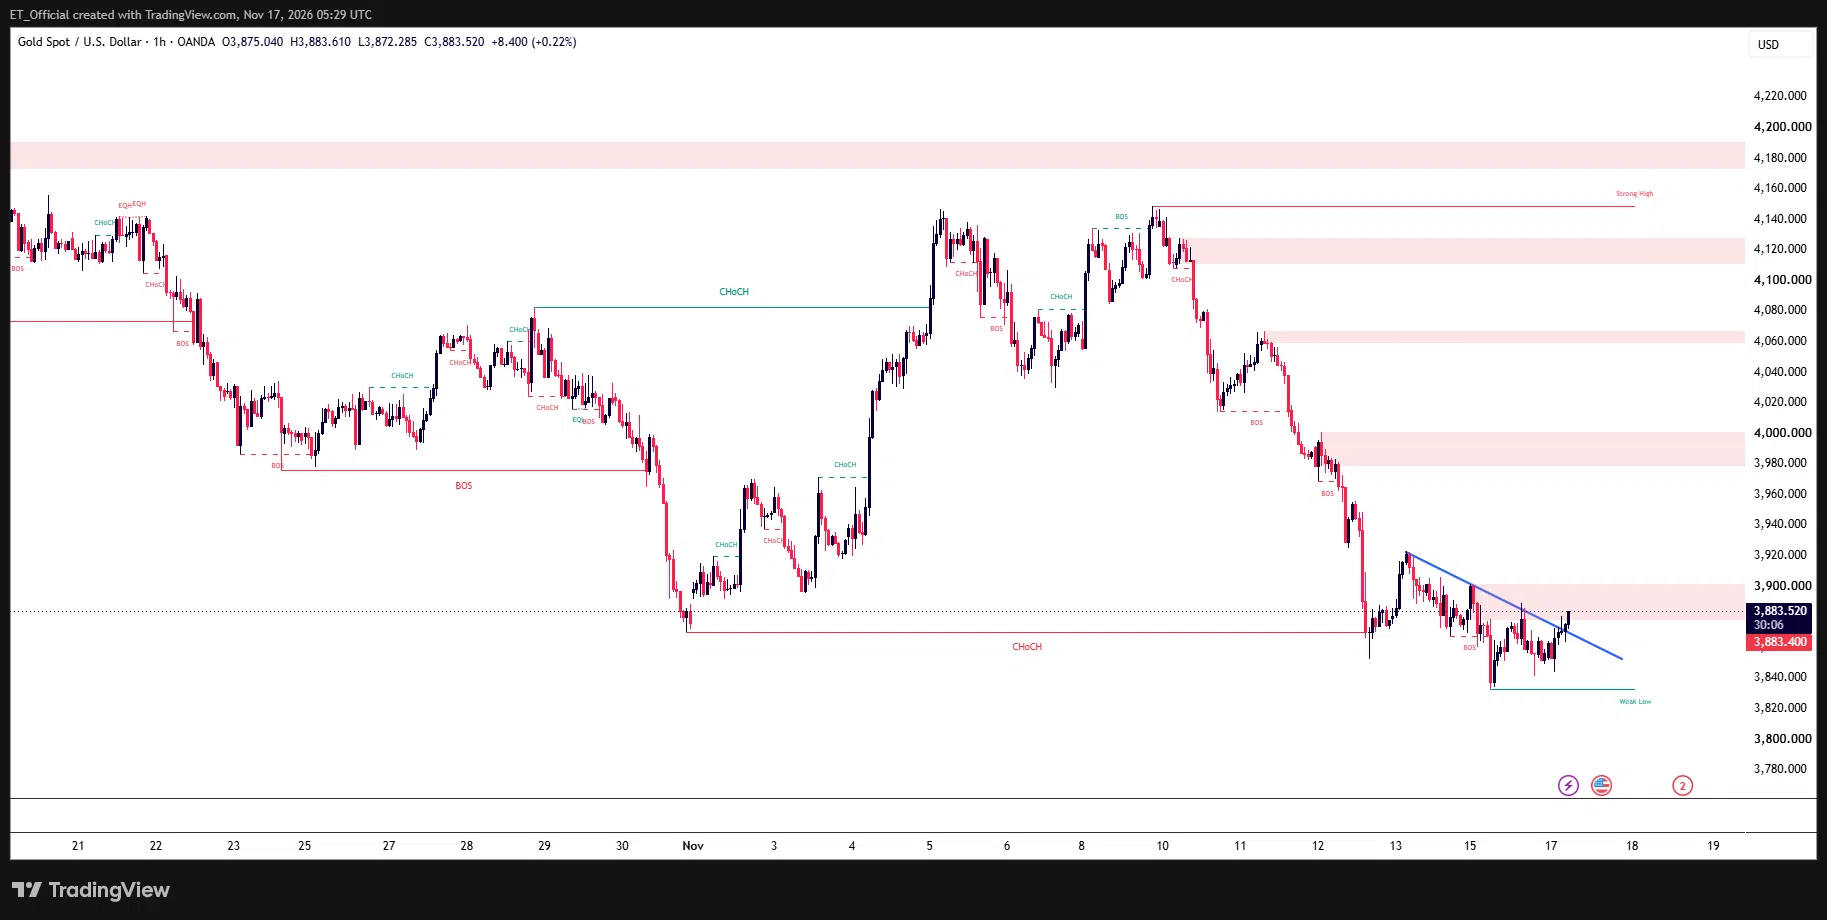
Chart: Gold (XAU/USD), 1H timeframe (TradingView, SMC)
Gold (XAU/USD) 1H chart, 21 October to 17 November 2026: price fell from a high near 4,148 on 10 November through the 3,869 change of character level to a low near 3,832 on 16 November, and is trading at 3,883.52 above a broken descending trendline and inside the 3,877 to 3,900 supply zone.
The 1H chart shows gold falling from a high near 4,148 on 10 November, where the 4,111 to 4,128 supply zone rejected price, through 4,060 and the 3,978 to 4,000 zone to the 3,869 low from 30 October, which broke on 12 November. It reached a low near 3,832 on Monday, with spot touching about 3,831, and has since rebounded and broken a descending trendline from the 13 November high near 3,921.
Price is at 3,883.52, inside the 3,877 to 3,900 supply zone, which is the old support from the 30 October low. Gold futures fell 0.9% on Monday, silver fell 4.6%, the dollar index is near 103.5 and the 10-year yield is 5.12%. Fed Chair Warsh spoke on AI and jobs on Monday without signalling on rates, and December hike odds stayed near 90%.
A close above 3,900 would be the first sign the break is real, with 3,978 to 4,000 the next supply. Below, the 3,832 low is the line, and a trendline break inside supply can fail quickly. Retail sales, Waller and Hammack today and the FOMC minutes at 19:00 UTC tomorrow are the likely catalysts.
EUR/USD: Oversold at a 19-Month Low
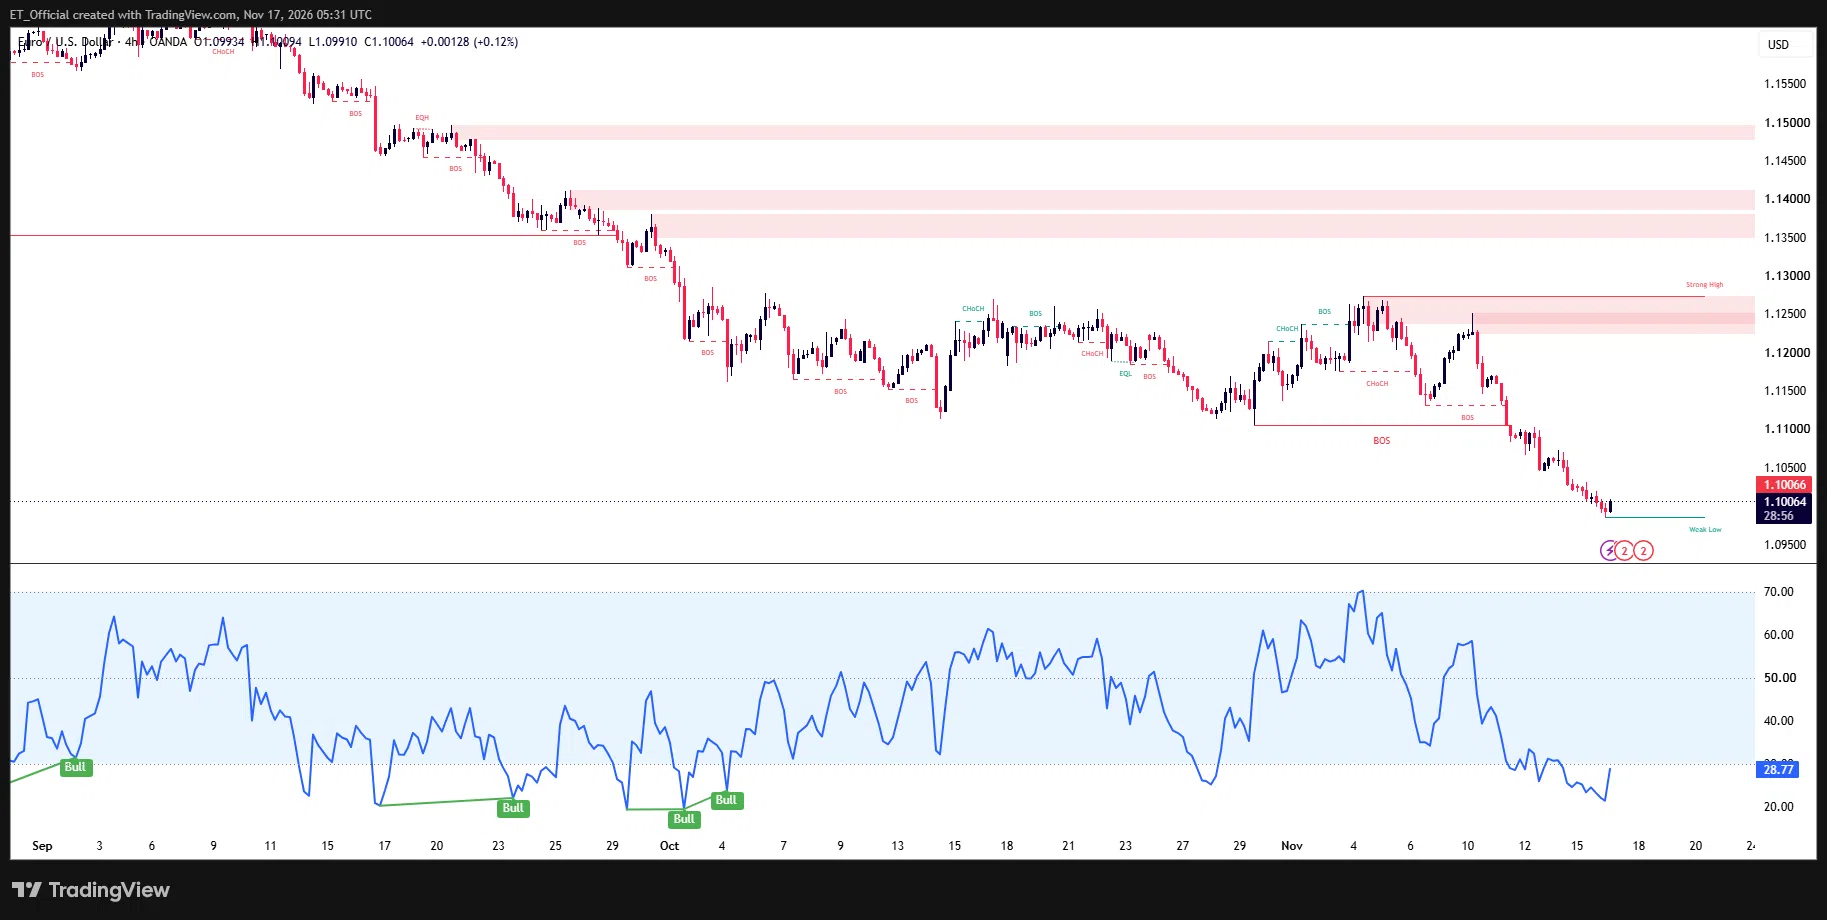
Chart: EUR/USD, 4H timeframe with RSI (TradingView, SMC)
EUR/USD 4H chart with RSI, 1 September to 17 November 2026: price rallied to a high near 1.1250 on 10 November, then fell through the 1.1104 low to near 1.0986, and is trading at 1.1006 with RSI at 28.77 below the 1.1220 to 1.1270 supply zone.
The 4H chart shows EUR/USD rejected at the 1.1220 to 1.1270 supply zone, with a high near 1.1250 on 10 November, and then falling through the 1.1104 low from 30 October in a steady run to about 1.0986. It is down about 2.3% from that high and trading in a zone with no marked demand on the chart beneath it, while the pair has fallen from 1.17 in August.
RSI is at 28.77 and turning up from oversold, but price has made only small bounces so far. The dollar index is at its highest since April 2025, and sources point to markets pricing more Fed hikes than the European Central Bank, French political and fiscal uncertainty, and a weaker eurozone growth outlook. ECB Vice President Vujcic said on Monday that market expectations for further 2027 hikes could prove justified.
Above, the broken 1.1104 low is the first test, then the 1.1220 to 1.1270 supply zone, and a recovery needs to hold above 1.1104 to change the picture. Below, 1.0986 is the low and 1.10 the round number being tested. US retail sales at 13:30 UTC and final euro area inflation on Wednesday are the catalysts.
Risk Warning: Trading financial instruments, particularly those involving leverage, involves a substantial degree of risk and is not appropriate for all investors. The value of your investments can rise or fall sharply, and it is possible to lose the entirety of your invested capital. Leveraged products, in particular, amplify both potential gains and losses. Before engaging in such trading, you must assess your financial goals, experience level, and appetite for risk. It is your sole responsibility to ensure that you understand the mechanics and risks of trading, including margin requirements, and to seek independent financial advice where appropriate. Do not trade with funds you cannot afford to lose. Nothing in this article constitutes financial advice or a personal recommendation, and nothing in this site should be read or construed as constituting advice on the part of Taurex or any of its affiliates, directors, officers or employees. All levels referenced are for educational and illustrative purposes only.