
Key Points
- Silver has broken above the $64 to $66 supply zone on the H4 chart, trading at $65.72 after a 12% rally over the past month. Four bull RSI divergences built the base from the $56 strong low, and consecutive breaks of structure confirm the bullish trend. Three bear RSI divergences at the current highs warn that the push toward the $68 weak high could stall. Silver’s dual role as a safe haven and industrial commodity continues to drive outperformance against gold in percentage terms.
- GBP/USD sits at 1.3553, just below the weak high at 1.3560, with consecutive bullish BOS signals confirming the rally from the 1.3270 strong low. This is one of the heaviest data weeks of the month for sterling, with Claimant Count on Tuesday, CPI on Wednesday, and Retail Sales on Friday. A break above 1.3560 opens the path toward 1.3700, while rejection risks a pullback to the 1.3400 equal lows.
- Wednesday is the pivotal session with UK CPI and FOMC Meeting Minutes released hours apart. UK headline inflation is forecast to jump from 2.6% to 2.9%, driven by the July energy cap rise, which could delay Bank of England rate cuts and support sterling. The FOMC minutes from the July meeting will reveal the depth of the three way dissent, where three members voted to hike while the majority held at 3.50% to 3.75%.
Last Week in Review
Markets came into this week with a split personality. The NASDAQ gained 1.43% over the past five days and the Nikkei surged 2.92%, but the FTSE fell 1.03% and the ASX dropped nearly 2%. US 10 year yields sit at 4.63% with the curve at +51bps, and the Fed held rates at 3.50% to 3.75% in July with three dissenters pushing for a hike. The precious metals complex continues to lead, with gold pressing all time highs above $4,400 and silver following with a delayed but decisive breakout through its own supply zone.
Sterling quietly outperformed most major currencies last week, with GBP/USD pushing from 1.3450 to 1.3553 as the market priced in a hawkish Bank of England stance ahead of this week’s inflation data. The combination of UK labour market numbers, CPI, FOMC minutes, and flash PMIs all landing within the same five day window makes this one of the most catalyst rich weeks of the summer for both sterling and metals traders.
Silver (XAG/USD): The Delayed Breakout
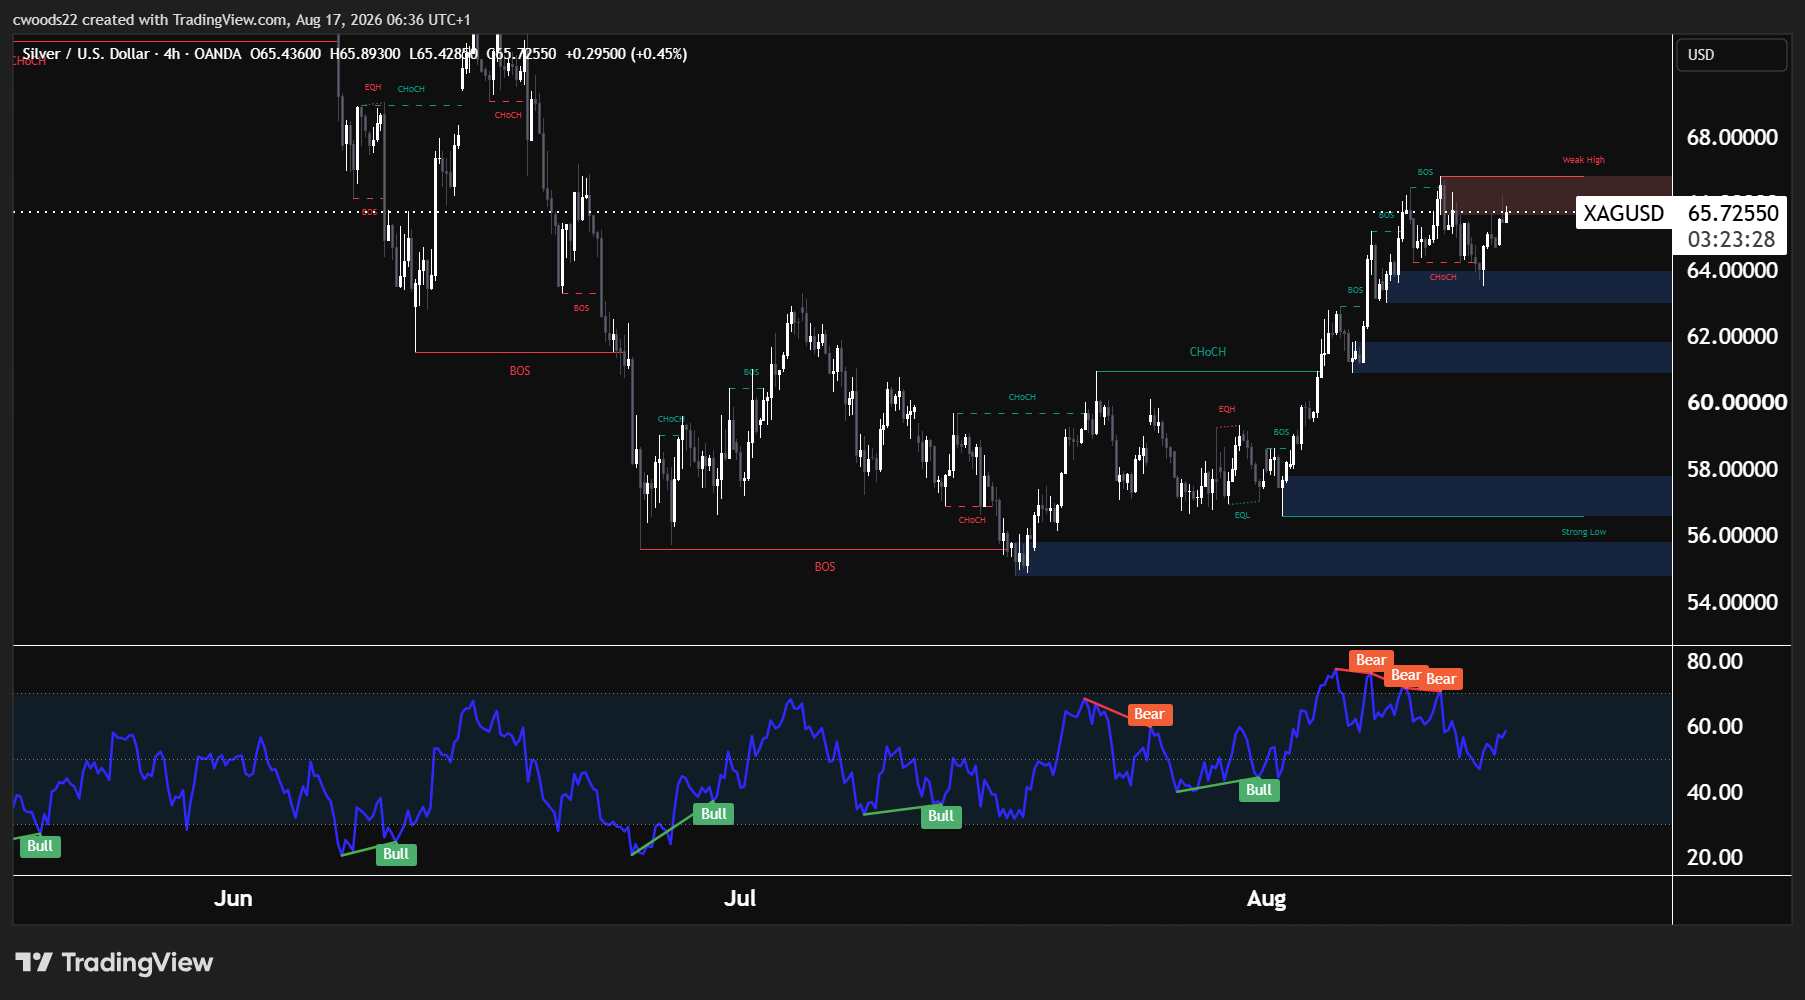
Chart: XAG/USD, H4 timeframe (TradingView, SMC)
Silver has spent most of 2026 in gold’s shadow, but the H4 chart tells the story of a metal that has been building a base with patience. Four bull RSI divergences formed between May and August, each one at the lows, signalling that selling pressure was systematically fading. The strong low at $56 held on every test, and equal lows (EQL) near $57 provided the structural floor that buyers kept defending.
The breakout came through the $64 to $66 supply zone, where sellers had previously capped rallies. Price is now at $65.72 with multiple breaks of structure confirming the bullish trend. The next target is the weak high near $68, where equal highs (EQH) sit as a liquidity magnet. Silver has gained 12% in the past month and over 70% year on year, outpacing gold in percentage terms thanks to its dual role as both a monetary and industrial commodity. Demand from the solar sector and electronics manufacturing continues to provide a structural tailwind that gold does not have.
The caution comes from the RSI. Three bear divergences have formed at the current highs, with price printing higher highs while RSI prints lower highs. This pattern preceded pullbacks earlier in the summer and suggests that the push toward $68 could stall. If the divergences play out, the first support sits at $64 (the top of the broken supply zone, now acting as demand), with the change of character level near $60 as the deeper pullback target. A clean break above $68 would invalidate the divergences and open the path toward $72 to $75.
The fundamental case remains intact. Safe haven flows from the unresolved Hormuz situation continue to support precious metals broadly, while silver’s industrial demand from photovoltaic manufacturing and electronics adds a second pillar that gold does not have. Analysts at BlackRock and JP Morgan see silver above $80 by year end, though the technical picture suggests the $68 weak high needs to be cleared before that conversation becomes relevant.
GBP/USD: Data Week at the Weak High
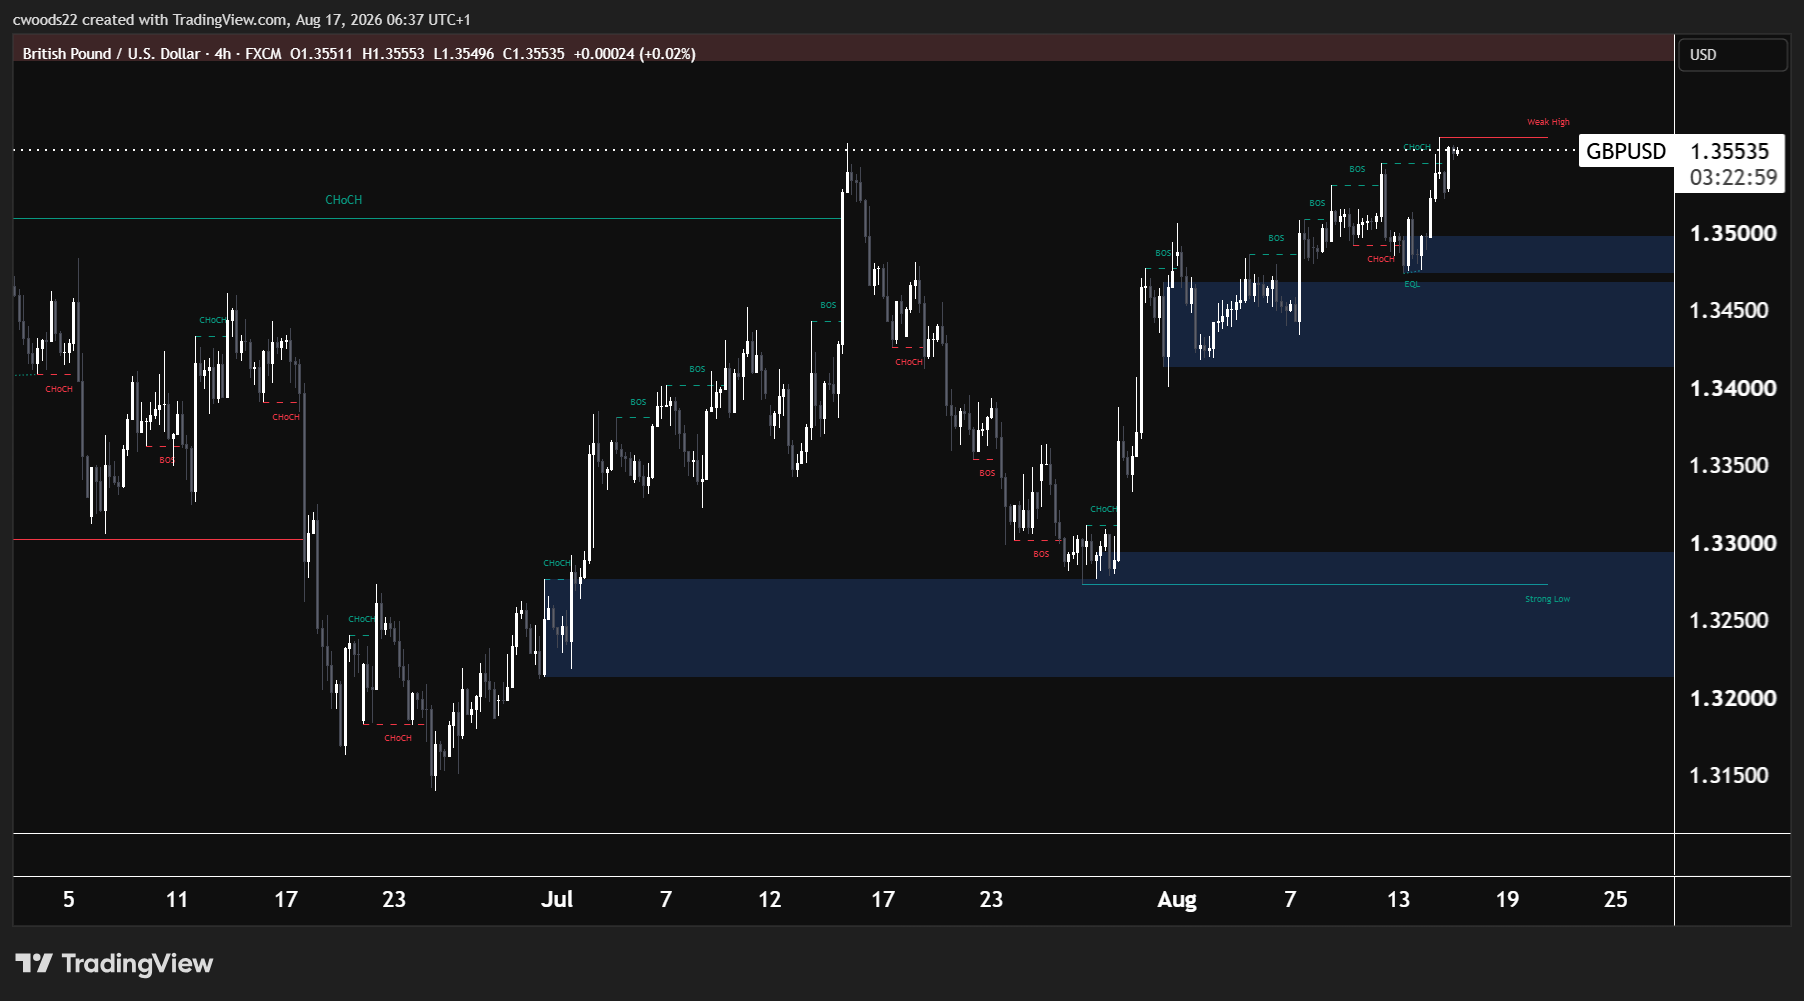
Chart: GBP/USD, H4 timeframe (TradingView, SMC)
Cable has been grinding higher since the 1.3150 low in late June, and the structure on the H4 chart is textbook bullish. Multiple changes of character confirmed the shift during July, and consecutive breaks of structure through August have pushed price to 1.3553, just pips from the weak high at 1.3560. The strong low at 1.3270 is the structural floor, with a demand zone between 1.3250 and 1.3300 providing the base.
The setup is straightforward: a break above 1.3560 would invalidate the weak high and establish a new structural high, opening the path toward 1.3700. Failure to break would turn the weak high into a rejection zone, with the equal lows (EQL) near 1.3400 as the first downside target where stop losses are likely clustered. The investment bank consensus has Q3 at 1.3300, meaning cable is already trading well above where most forecasters expected it to be. That overshoot either reflects genuine sterling strength or a vulnerability if the data disappoints.
Tuesday’s Claimant Count sets the tone. The forecast of 11.2K (from 6.7K) suggests a softening labour market, which could undermine sterling if the print is worse than expected. Average earnings are forecast to cool from 4.3% to 4.0%, adding to the mixed picture. Wednesday’s CPI is the main event, with headline inflation expected to jump from 2.6% to 2.9%, largely driven by the July Ofgem energy cap increase. A hotter print would reinforce the Bank of England’s hawkish stance and support the pound, while a miss could trigger a reassessment of the rate path and give the bear case at 1.3560 the ammunition it needs.
The FOMC minutes on Wednesday evening add a dollar dimension. If the minutes reveal deeper hawkish sentiment among the three dissenters, the dollar could strengthen and pressure cable from the other side. A more balanced tone could do the opposite. Friday’s UK Retail Sales (forecast of a 0.4% contraction after a strong 1.0% prior) and flash PMIs round out the week. This is a pair where the data will decide the direction, and the weak high at 1.3560 is the line in the sand.
Key Events This Week
Tuesday 18 August UK Labour Market Data
Claimant Count Change is forecast at 11.2K (from 6.7K) and Average Earnings at 4.0% (from 4.3%). A sharper rise in claims or a bigger drop in wage growth would weaken sterling and give GBP/USD bears ammunition at the 1.3560 weak high. A resilient print keeps the rally intact.
Wednesday 19 August UK CPI (July)
Headline inflation is expected to jump from 2.6% to 2.9% year on year, primarily driven by the Ofgem energy cap increase that took effect in July. Core CPI is forecast to edge down from 2.6% to 2.5%. A hotter headline print would support the pound by keeping Bank of England rate cuts off the table, while a miss below 2.7% could trigger a pullback in GBP/USD.
Wednesday 19 August FOMC Meeting Minutes (July)
The July meeting saw three dissenters vote to hike while the majority held at 3.50% to 3.75%. The minutes will reveal how close the decision was and whether the hawks are gaining ground. A hawkish tone would strengthen the dollar and pressure both GBP/USD and silver, while a more balanced read could provide a tailwind for both setups.
Risk Warning: Trading financial instruments, particularly those involving leverage, involves a substantial degree of risk and is not appropriate for all investors. The value of your investments can rise or fall sharply, and it is possible to lose the entirety of your invested capital. Do not trade with funds you cannot afford to lose. Nothing in this site should be read or construed as constituting advice on the part of Taurex or any of its affiliates, directors, officers or employees.