
Back from the Brink
By Connor Woods, Global Head of Trading Education | 7 July 2026
Key Points
- Nonfarm payrolls shocked at 57,000 (against a forecast of 110,000), the weakest print in four months. Leisure and hospitality shed 61,000 jobs as the World Cup distorted seasonal hiring patterns. The dollar sold off before recovering on expectations that a cooling labour market gives the Fed room to hold rather than hike.
- NZD/USD has printed a bullish Change of Character (CHoCH) and Break of Structure (BOS) above 0.5700 on the H4 chart after bouncing from demand near the Weak Low at 0.5640. The RBNZ is expected to hold rates at 2.25% on Wednesday, with rate hikes pencilled in from September, giving the Kiwi fundamental support for the weeks ahead.
- BTC/USD is attempting to recover from 21 month lows near $58,000 after June’s record $4.06 billion in ETF outflows. A bullish CHoCH and BOS above $63,000 suggest demand is holding, but the supply zone between $65,000 and $67,000 needs to break before the recovery can be taken seriously.
Last Week in Review
Markets returned from a shortened holiday week with plenty to digest. Thursday’s nonfarm payrolls report was the headline, printing at just 57,000 against expectations of 110,000 and a downwardly revised 129,000 the month before. The miss was amplified by a 61,000 drop in leisure and hospitality jobs, a distortion likely caused by the World Cup pulling seasonal hiring patterns forward. Professional and business services added 36,000 and healthcare contributed 22,000, but neither was enough to offset the damage.
Bitcoin touched 21 month lows below $58,000 before staging a late week recovery. The catalyst for the bounce came on July 3 when US spot Bitcoin ETFs pulled in $221 million in a single day, snapping a brutal 10 day outflow streak that had drained $2.73 billion from the funds. Fidelity’s FBTC led the charge with $166 million, though BlackRock’s IBIT continued to see outflows of $40 million.
The dollar index is consolidating near 100.30 after Fed Chair Kevin Warsh’s hawkish stance at the ECB Forum, where he called inflation “too high” while declining to hint at the July rate decision. June’s dot plot raised the year end median rate projection to 3.75%, all but confirming at least one hike before December.
NZD/USD: The Kiwi Fights Back
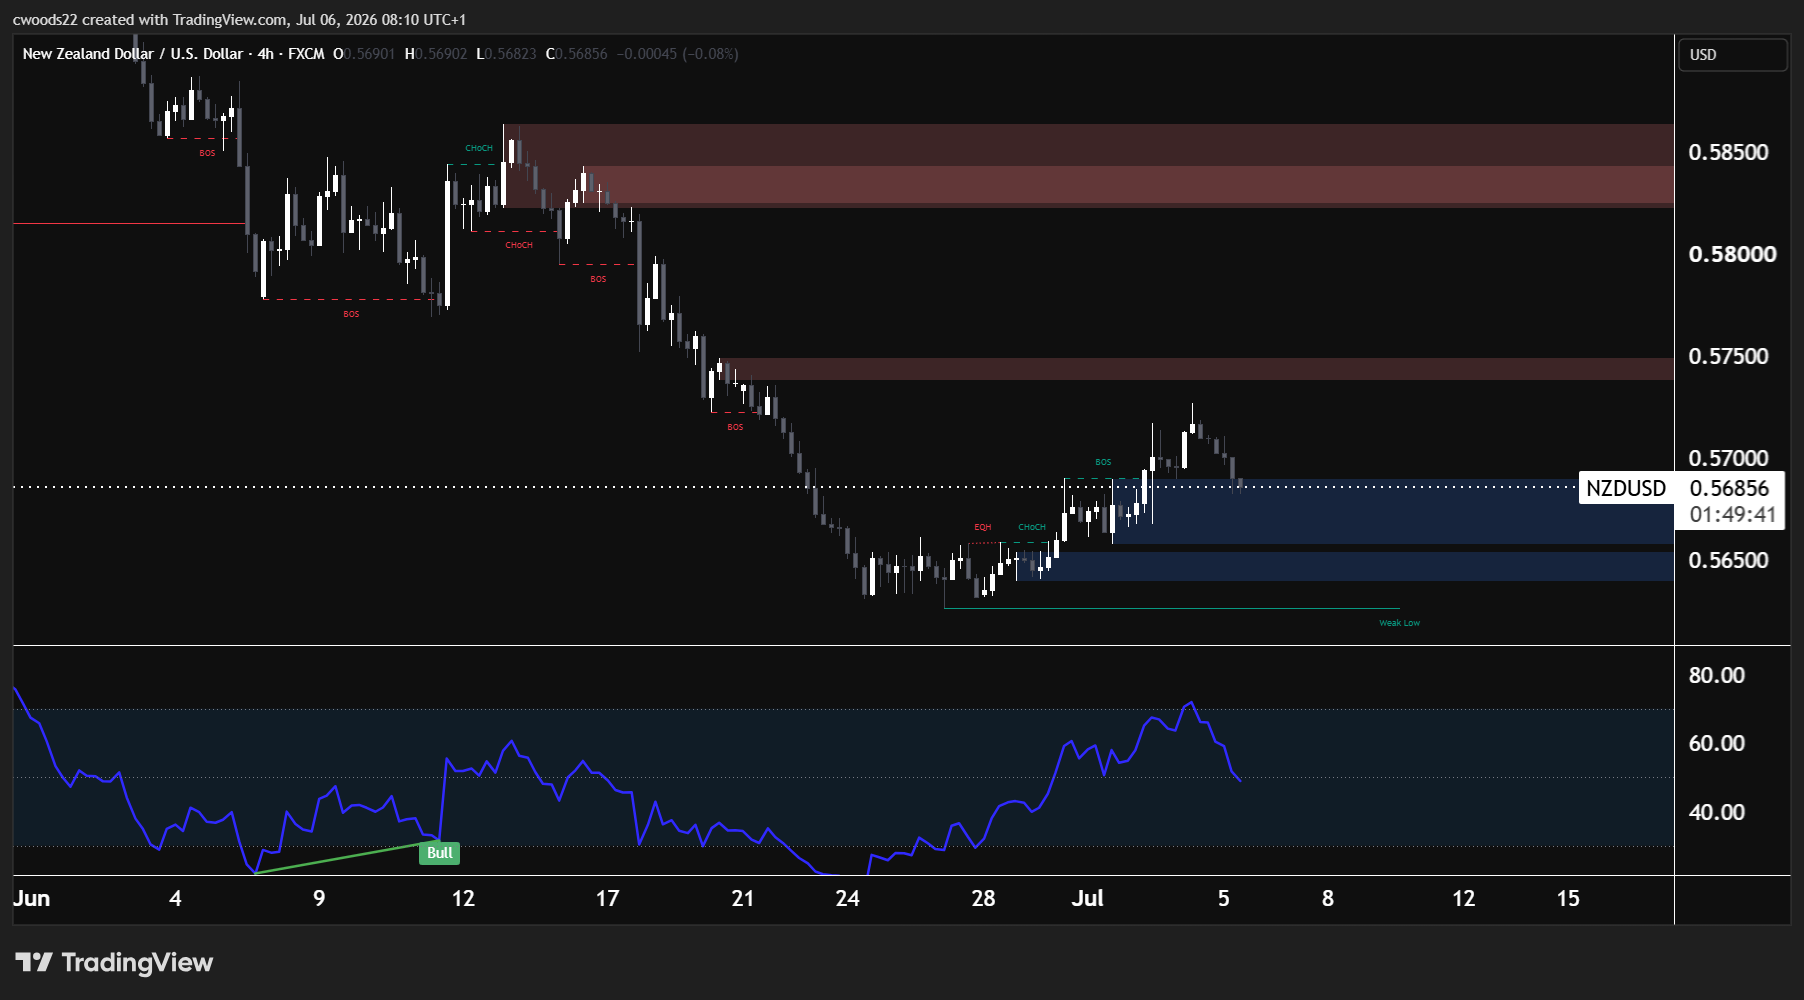
Chart: NZD/USD, H4 timeframe (TradingView, SMC)
The H4 chart tells the story of a trend reversal in progress. NZD/USD spent most of June in a clear downtrend, falling from 0.5870 to the Weak Low at 0.5640 through a series of bearish Break of Structure (BOS) moves at 0.5800, 0.5750, and 0.5720.
The shift came in late June. Price found demand in the blue zone between 0.5640 and 0.5680, printing a bullish Change of Character (CHoCH) near 0.5670. An RSI Bull divergence confirmed the momentum shift: price was making lower lows while RSI was making higher lows, signalling that selling pressure was fading. The subsequent BOS above 0.5700 confirmed that buyers had retaken short term control.
The level to watch this week is the supply zone between 0.5830 and 0.5860. That is where the previous bearish structure originated, and sellers are likely to defend it. A clean break above 0.5860 would open a path back toward 0.5900. On the downside, a rejection at supply that sends price below 0.5700 would invalidate the reversal and suggest the bearish trend is resuming.
Fundamentally, the RBNZ decision on Wednesday is the key risk event. Markets expect a hold at 2.25%, which is already priced in. The focus will be on the guidance: Westpac and ASB both expect rate hikes to begin in September, with the OCR potentially reaching 3.0% by year end. Any hawkish language around the timing of those hikes could provide the catalyst for NZD to push through that supply zone. The COT data adds an interesting layer. Leveraged money is net short 22,822 contracts at the 2nd percentile of the 52 week range, the most bearish positioning in almost a year. Extreme short positioning like this can fuel sharp squeezes if the fundamental picture shifts even slightly.
BTC/USD: Dead Cat or Genuine Recovery?
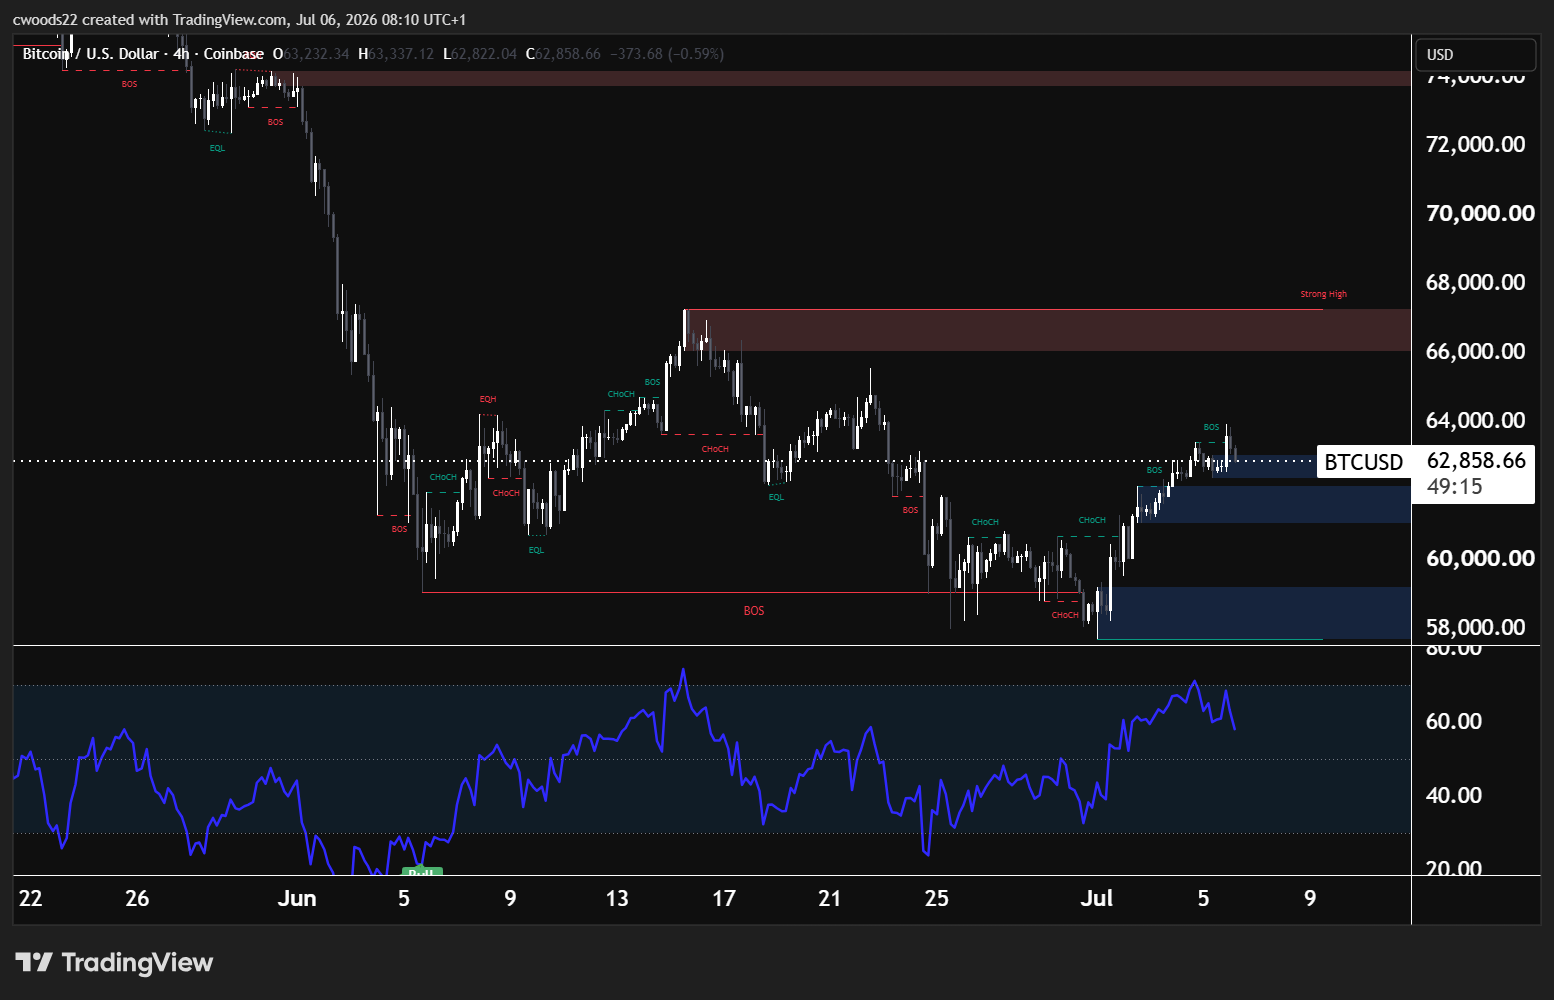
Chart: BTC/USD, H4 timeframe (TradingView, SMC)
BTC/USD has been in freefall for six weeks, crashing from $74,000 in late May to 21 month lows near $58,000 in early July. June was the worst month for Bitcoin ETF flows since the products launched, with $4.06 billion in net outflows surpassing the previous record of $3.56 billion set in February 2025. Citigroup cut its 12 month price target from $112,000 to $82,000.
The H4 chart shows the damage clearly. A series of bearish BOS moves from $74,000 through $68,000, $63,000, and down to $59,000 established a textbook impulsive sell off. The demand zone between $58,000 and $60,000 (the blue shaded area) is where buyers finally stepped in.
The reversal signals are emerging. A bullish CHoCH near $60,000 was followed by a BOS above $63,000, confirming a short term structural shift. RSI printed a Bull divergence at the lows, mirroring the pattern seen on NZD/USD. Price is now sitting at $62,858, sandwiched between that confirmed BOS level and the supply zone between $65,000 and $67,000.
The ETF flow reversal on July 3 ($221 million in net inflows) is encouraging but needs follow through. One day of buying does not reverse a trend, especially when the largest fund (BlackRock’s IBIT) was still seeing outflows. Standard Chartered maintains a $100,000 year end target while Citigroup has cut to $82,000. If inflows continue this week and price clears the $65,000 to $67,000 supply zone, the case for a sustained recovery strengthens. A failure at supply and a return below $60,000 would suggest the bounce was nothing more than a dead cat, with the Strong High at $68,000 remaining well out of reach.
Key Events This Week
Wednesday 8 July RBNZ Interest Rate Decision
Expected to hold at 2.25%. Markets are watching the guidance for signals on when hikes begin. September is the consensus start date, with the OCR projected to reach 3.0% by year end.
Wednesday 8 July FOMC Meeting Minutes
Minutes from Kevin Warsh’s first meeting as Fed Chair in June. The dot plot raised the year end median to 3.75%, confirming at least one hike. Warsh has abandoned explicit forward guidance, so traders will parse the language for clues on timing.
Risk Warning: Trading financial instruments, particularly those involving leverage, involves a substantial degree of risk and is not appropriate for all investors. The value of your investments can rise or fall sharply, and it is possible to lose the entirety of your invested capital. Do not trade with funds you cannot afford to lose. Nothing in this site should be read or construed as constituting advice on the part of Taurex or any of its affiliates, directors, officers or employees.