
July 2026 | Gold Below $4,000, the Central Bank Double Header, and Earnings Season
By Connor Woods, Global Head of Trading Education | 1 July 2026
Key Points
- Gold has broken below $4,000 for the first time since early 2026, trading at $3,979. The same Iran conflict that pushed gold above $5,000 in January has now boomeranged: energy driven inflation forced the Fed into a hawkish corner, the dollar surged, and gold paid the price. Two Bull RSI divergences on the daily chart suggest the selling may be exhausting itself, but the FOMC on July 29 will have the final say.
- NASDAQ 100 at 30,091 is knocking on the door of all time highs, but RSI Bear divergence is flashing a warning that momentum is fading just as earnings season arrives. Microsoft, Meta, Amazon, Apple, and Alphabet all report in the final two weeks of July. If AI spending translates into real profit growth, the index breaks out. If not, the divergence bites.
- EUR/USD at 1.1394 faces a defining month. The ECB decides on July 23 and the FOMC follows on July 29, with the rate gap still 125 to 150 basis points in the dollar’s favour. A break below the Weak Low at 1.1300 would send the pair to levels not seen since late 2024.
Month in Review: June 2026
June belonged to Kevin Warsh. His first FOMC meeting delivered no rate change, but the message was unmistakable: the dot plot shifted to a 3.8% year end median, with nine of nineteen officials now expecting at least one hike. Rate cuts, which the market was pricing at the start of the year, are officially off the table.
The inflation numbers back him up. US CPI hit 4.2% in May, the highest since April 2023. The culprit is energy: prices surged 23.5% on the back of the Iran conflict that disrupted the Strait of Hormuz earlier this year. The ceasefire is holding, but shipping through the Strait is still at just 5% of normal capacity and Brent crude remains around $81, roughly $20 above where it started the year. Core PCE jumped to 3.4% year on year, giving the Fed zero room to ease.
The dollar took full advantage. The DXY broke above 100, gold fell from $4,500 to below $4,000 in a single month, EUR/USD slid to 1.1394, and USD/JPY hit 162.65 (the weakest yen since 1986). The ECB hiked 25 basis points to 2.25% on June 11, but it barely registered because the rate gap still favours the dollar by 125 to 150 basis points. In the UK, Starmer resigned as PM, though sterling has since stabilised on expectations of an orderly transition.
The one market that shrugged it all off? US equities. The NASDAQ 100 ended June at 30,091, within striking distance of all time highs, propped up by AI earnings momentum. Whether that momentum survives July’s reporting season is the big question.
The Month Ahead
The setup for July is straightforward: the dollar is king, and everything else is reacting to it. The Fed is leaning toward a hike, inflation is sticky, and the geopolitical aftershocks from the Iran conflict are still feeding through energy prices into every corner of the economy. Until one of those pillars cracks, gold and the euro stay under pressure, and equities rely entirely on earnings to justify their altitude. Here are the dates that matter.
Thursday 2 July Nonfarm Payrolls
Forecast 114K versus last month’s 172K. Moved to Thursday because of July 4th, which means thinner liquidity and bigger moves. A beat above 150K supercharges the dollar. A miss below 100K reopens the rate cut debate.
Friday 4 July US Independence Day
Markets closed. Thin liquidity lingers into the following Monday.
Tuesday 14 July US CPI (June Data)
The last major inflation reading before the FOMC. If energy costs start fading from the numbers, everything changes. If they do not, July 29 gets even more hawkish.
Mid to Late July Earnings Season Ramps Up
TSMC and ASML report first, giving the early read on semiconductor demand and AI infrastructure spending. Then the heavyweights: Alphabet, Tesla, Microsoft, Meta, Amazon, and Apple all report in the final week. The market is pricing 20% tech earnings growth. Anything less and the NASDAQ divergence bites.
Wednesday 23 July ECB Rate Decision
Does the ECB hike again to fight 3.2% Eurozone inflation, or pause and risk falling further behind the Fed? The answer sets the floor (or trapdoor) for EUR/USD.
Wednesday 29 July FOMC Meeting
The main event. Nine of nineteen Fed officials already expect a hike this year. If Warsh pulls the trigger, gold and the euro extend lower. If he holds and softens the tone, expect a sharp relief rally across both. Two central banks, six days apart, one week that sets the direction for the rest of 2026.
Gold (XAU/USD): Below $4,000 for the First Time
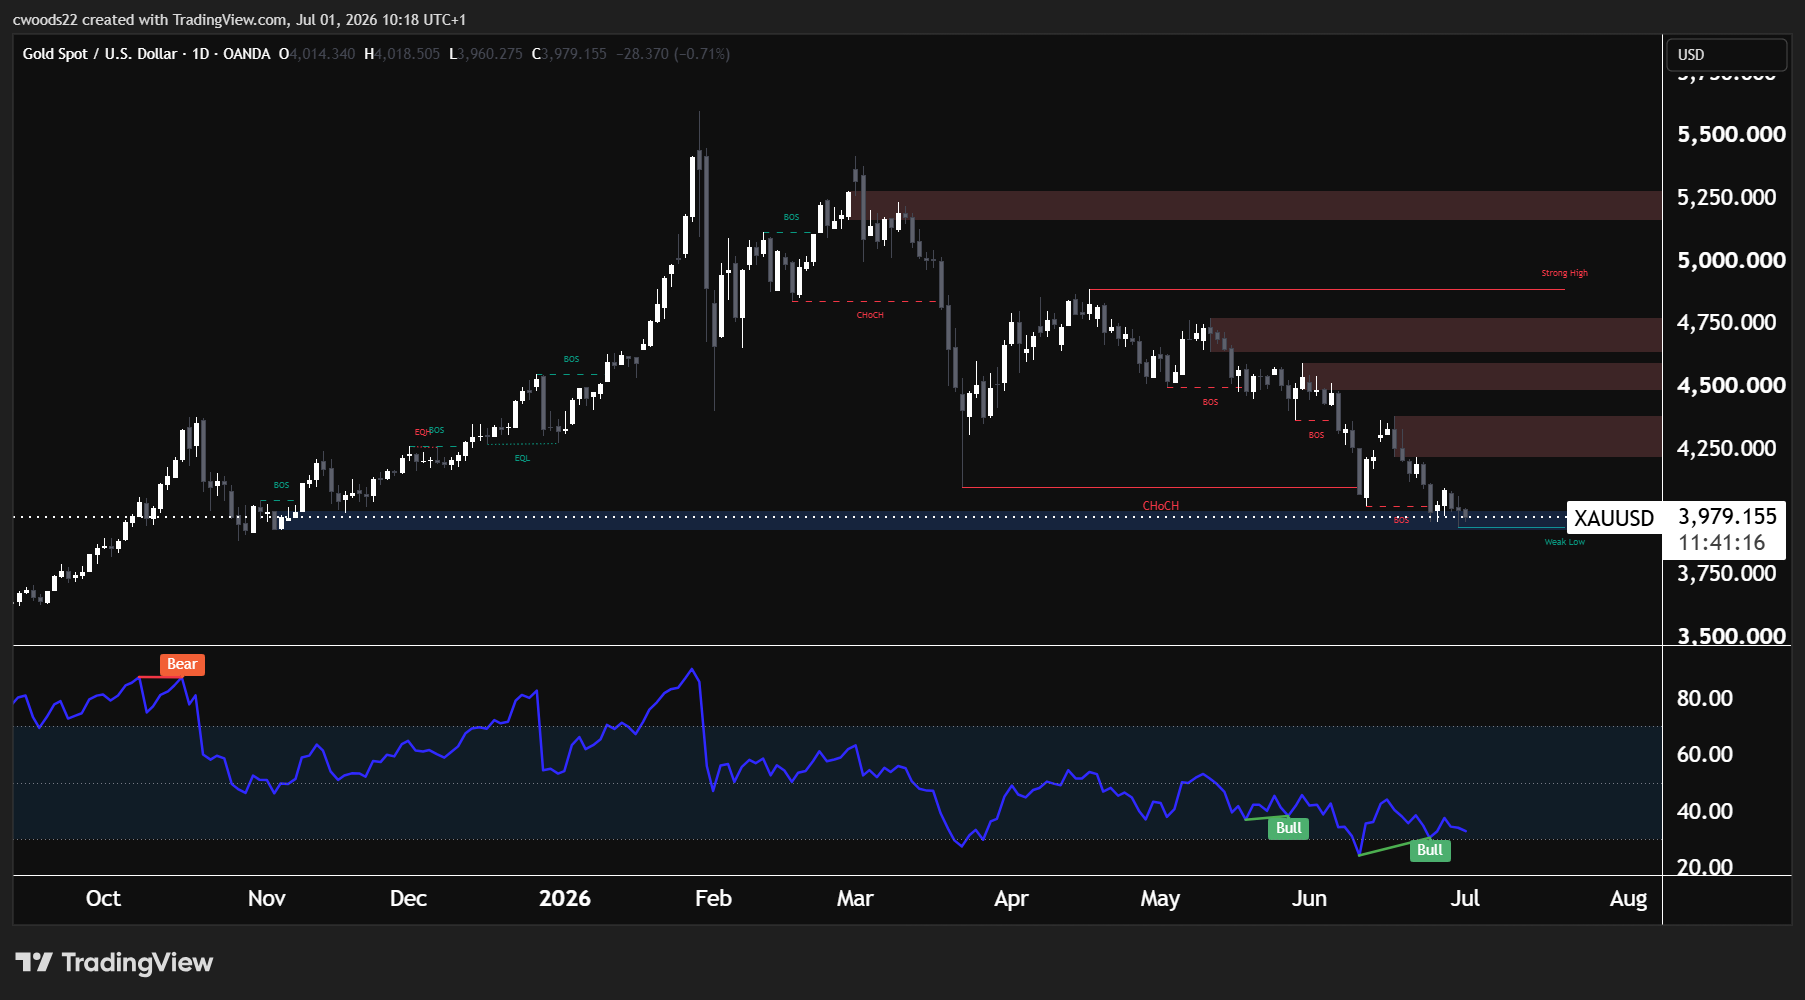
Chart: XAU/USD, Daily timeframe (TradingView, SMC)
Gold at $3,979 has broken below $4,000 for the first time since early 2026, and the irony is worth spelling out. The Iran conflict that sent gold above $5,000 in January on safe haven demand also spiked energy prices by 23.5%, which pushed inflation to 4.2%, which forced Warsh into a hawkish stance, which sent the dollar surging, which is now crushing gold. The safe haven bid is gone, but the inflationary aftershock remains.
The daily chart shows the full unwinding. The Change of Character (CHoCH) at $4,050 marked the structural shift from bullish to bearish, and every rally since has been sold into the supply zones between $4,250 and $4,500. Break of Structure (BOS) confirmations at $4,350, $4,150, and $4,050 have marked each leg down. The Strong High near $5,000 is a long way from here.
What stands out now is the RSI. Two Bull divergences have appeared at the bottom of the chart: price is making lower lows, but RSI is making higher lows. This tells us the selling pressure is weakening. It does not guarantee a reversal, but historically this type of signal precedes a relief bounce. The Weak Low at $3,900 is the next downside target and a likely area for stop losses to be swept before any meaningful recovery.
The FOMC on July 29 is gold’s event of the month. If Warsh signals a hike, expect $3,750. If inflation shows any sign of cooling, a bounce toward $4,200 is on the table. And as always with gold, any flare up in the Middle East could reignite the safe haven bid overnight.
NASDAQ 100 (NAS100): Earnings Season Will Decide
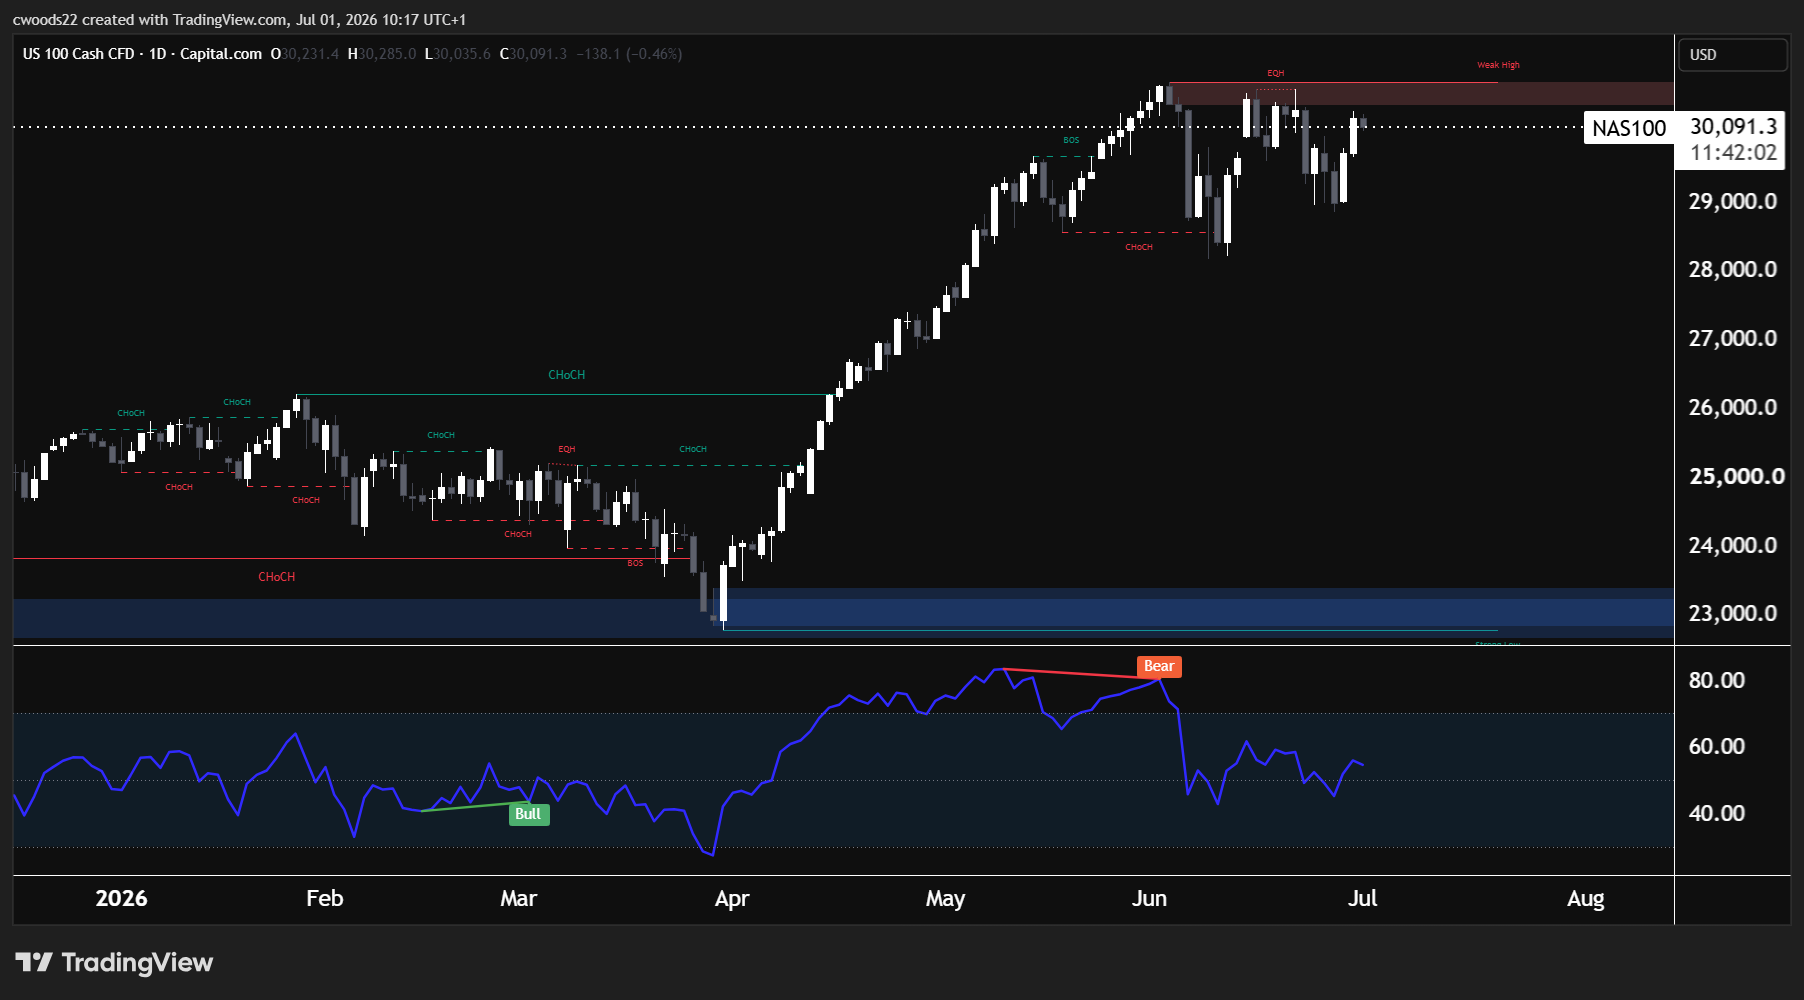
Chart: NAS100, Daily timeframe (TradingView, SMC)
The NASDAQ 100 at 30,091 has been the exception to every rule in 2026. While the dollar has steamrolled gold and the euro, US tech has rallied 30% from its March lows, powered by the AI investment cycle that continues to deliver earnings growth even in a high rate environment.
The daily chart shows why the rally worked. The CHoCH at 26,500 in March flipped the structure bullish, the BOS at 30,000 confirmed it, and the index pushed into the supply zone between 30,500 and 31,200 where the Equal Highs (EQH) and Weak High sit. That is the ceiling. To continue higher, the index needs to clear it.
The problem is the RSI Bear divergence: price made higher highs in June, but RSI made lower highs. This is the mirror image of the Bull divergence that called the March bottom perfectly. It does not mean the top is in, but it means the rally is running on fumes and any catalyst could trigger a pullback.
Earnings season is that catalyst, one way or the other. The market expects roughly 20% tech earnings growth, and that is priced in. Beats send the NASDAQ through the Weak High. Misses, even from one or two mega caps, could trigger a sharp sell the news reaction. Keep an eye on US/China trade commentary from TSMC and ASML as well, as any supply chain disruption headlines would hit the entire AI trade. Support sits at 28,000 and then 26,500 (where the March rally began) if things turn south.
EUR/USD: The Central Bank Double Header
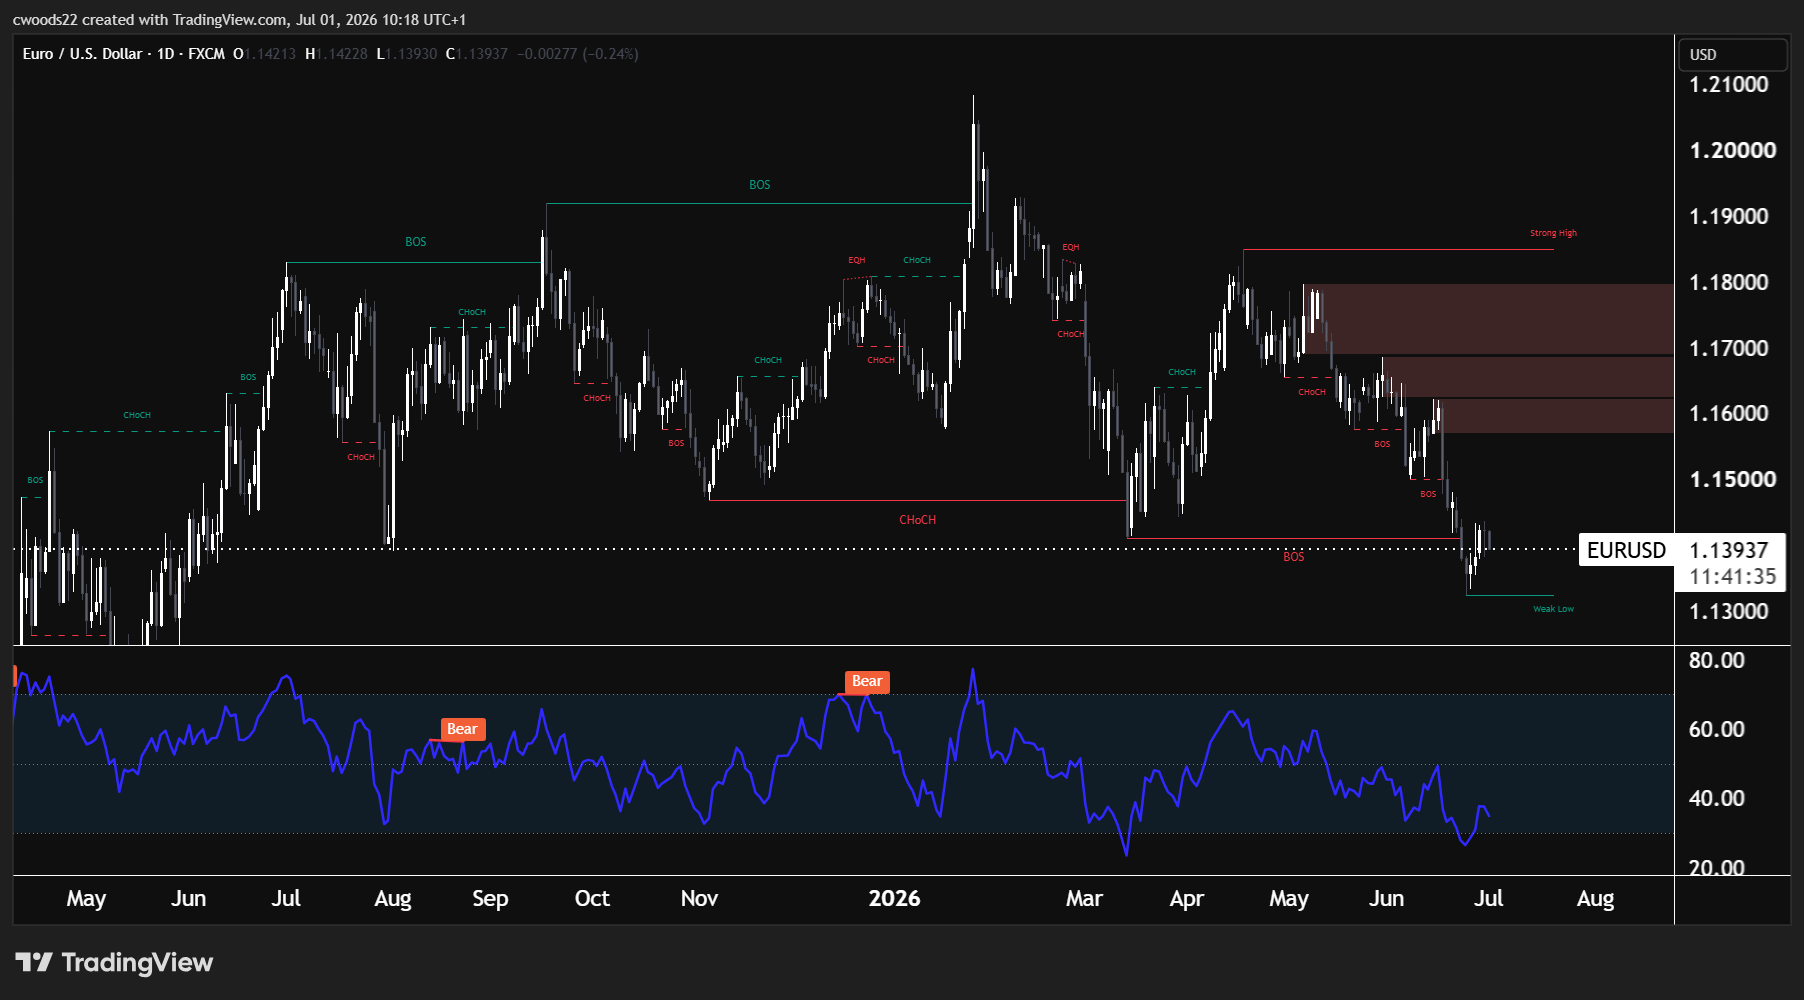
Chart: EUR/USD, Daily timeframe (TradingView, SMC)
EUR/USD at 1.1394 has completed a full round trip. The pair rallied from 1.1300 to 1.2100 through 2025 on expectations of Fed cuts and ECB holds. Those expectations have been completely reversed, and so has the price.
The daily chart tells the story cleanly. Two Bear RSI divergences (August and November 2025) warned on the way up that momentum was fading. The CHoCH at 1.1500 confirmed the bearish shift, and BOS at 1.1500 and 1.1400 have sealed it. The supply zone between 1.1700 and 1.1850, capped by the Strong High, is now heavy resistance. Below, the Weak Low near 1.1300 is the immediate target, and a break there opens 1.1200.
The fundamental problem for the euro is twofold. First, the rate gap: even after the ECB’s June hike to 2.25%, the Fed is still 125 to 150 basis points ahead, and money flows toward higher yields. Second, Europe is more exposed to the Iran energy disruption than the US. The slow recovery of Strait of Hormuz traffic hits European importers harder, which means Eurozone inflation is partly driven by costs the ECB cannot control through interest rates. Hiking into a supply driven inflation shock risks slowing growth without solving the problem.
The ECB on July 23 and the FOMC on July 29 will decide everything. If the ECB hikes and the Fed holds, the rate gap narrows and EUR/USD finds a floor. If the ECB pauses and Warsh hints at a hike, 1.1300 breaks and 1.1200 comes into view. Retail traders are 62% long, which historically tends to be a contrarian signal. The consensus is betting on a bounce, which should make euro bulls uncomfortable.
➤ View our economic calendar here
Risk Warning: Trading financial instruments, particularly those involving leverage, involves a substantial degree of risk and is not appropriate for all investors. The value of your investments can rise or fall sharply, and it is possible to lose the entirety of your invested capital. Do not trade with funds you cannot afford to lose. Nothing in this site should be read or construed as constituting advice on the part of Taurex or any of its affiliates, directors, officers or employees.