
Crude oil prices have been trading within a sideways range between $65 and $70 per barrel since the beginning of August, currently hovering around the $68 level. This horizontal trend is expected to persist in the near term, especially amid the prevailing uncertainty in the oil market, which is influenced by several conflicting factors that are keeping prices within this range. Oil prices have declined by approximately 9% since the start of the year.
Positive factors supporting oil prices include:
- Market expectations of three interest rate cuts by the U.S. Federal Reserve this year, which could boost oil demand.
- Ongoing geopolitical tensions, particularly between Russia and Ukraine, with continued Ukrainian strikes targeting Russian energy infrastructure. Additional tensions between the United States and Venezuela, along with the escalation of the Israeli war on Gaza — including a ground assault by Israel on Monday — are heightening fears of supply disruptions.
- Weakness in the U.S. Dollar Index, which recorded a level of 96.93 yesterday — the lowest since July 7, 2025 — providing upward momentum for oil prices due to their inverse relationship.
On the other hand, key factors putting downward pressure on crude oil prices include:
- Ample supply from non-OPEC+ producers.
- Weak economic data recently from major oil-importing countries such as China and the United States, which has dampened global oil demand.
Technical Analysis
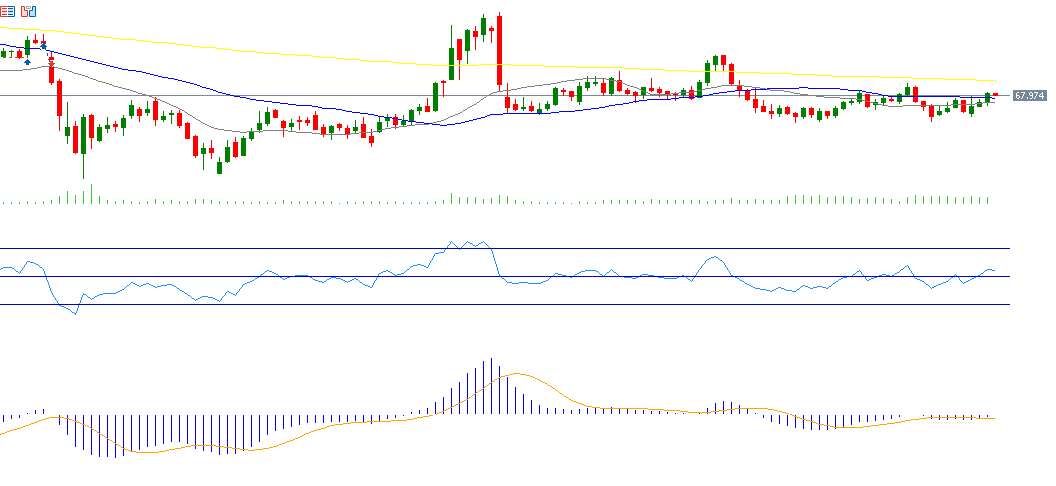
Currently, crude oil prices are trading above a key support level — the 20-day moving average (blue), which stands at $67.30 — and also hovering above the second support level, the 50-day moving average (grey), which stands at $68.00. A potential golden cross between the 20-day and 50-day moving averages could signal continued positive momentum in oil prices.
The upcoming challenge lies in whether prices can maintain levels above both the 20-day and 50-day averages, in an attempt to reach the resistance level, represented by the 200-day moving average (yellow), which stands at $70.15.
As for the Relative Strength Index (RSI), it currently stands at 54, indicating positive momentum. Additionally, a bullish crossover is visible between the MACD line (blue) and the Signal Line (orange), further supporting the potential continuation of the upward momentum in crude oil prices.
Please note that this analysis is provided for informational purposes only and should not be considered as investment advice. All trading involves risk.