
Key Points
- Silver has bounced from the demand zone near 57.00 with two bull RSI divergences and a bullish change of character above 57.50. The sell off from 59.00 was driven by renewed Iran tensions fuelling rate hike expectations, but a soft CPI print this morning would weaken the dollar and give silver the catalyst to push back toward the 58.50 to 59.00 supply zone.
- GBP/USD found demand at the equal lows near 1.3340 and has printed a bull RSI divergence followed by a bullish change of character and break of structure above 1.3360. The pound’s decline from 1.3440 was driven by dollar strength rather than sterling weakness, with UK inflation steady at 2.8% and the Bank of England still expected to hike by December. A weaker US CPI release could reverse the recent move.
- BTC/USD sold off from 63,200 to the demand zone near 62,000 where a bull RSI divergence triggered the recovery. ETF inflows have returned ($510 million across three sessions in early July) and Citigroup research shows each $100 million in net inflows correlates with a roughly 53 basis point same day price increase. The supply zone between 62,800 and 63,200 is the level to clear.
Trade 1: Silver (XAGUSD) Long from Demand
| Pair | Direction | Entry Zone | Target 1 | Target 2 | Invalidation |
| XAGUSD | Long | 57.80 to 58.20 | 58.50 | 59.00 | Below 57.00 |
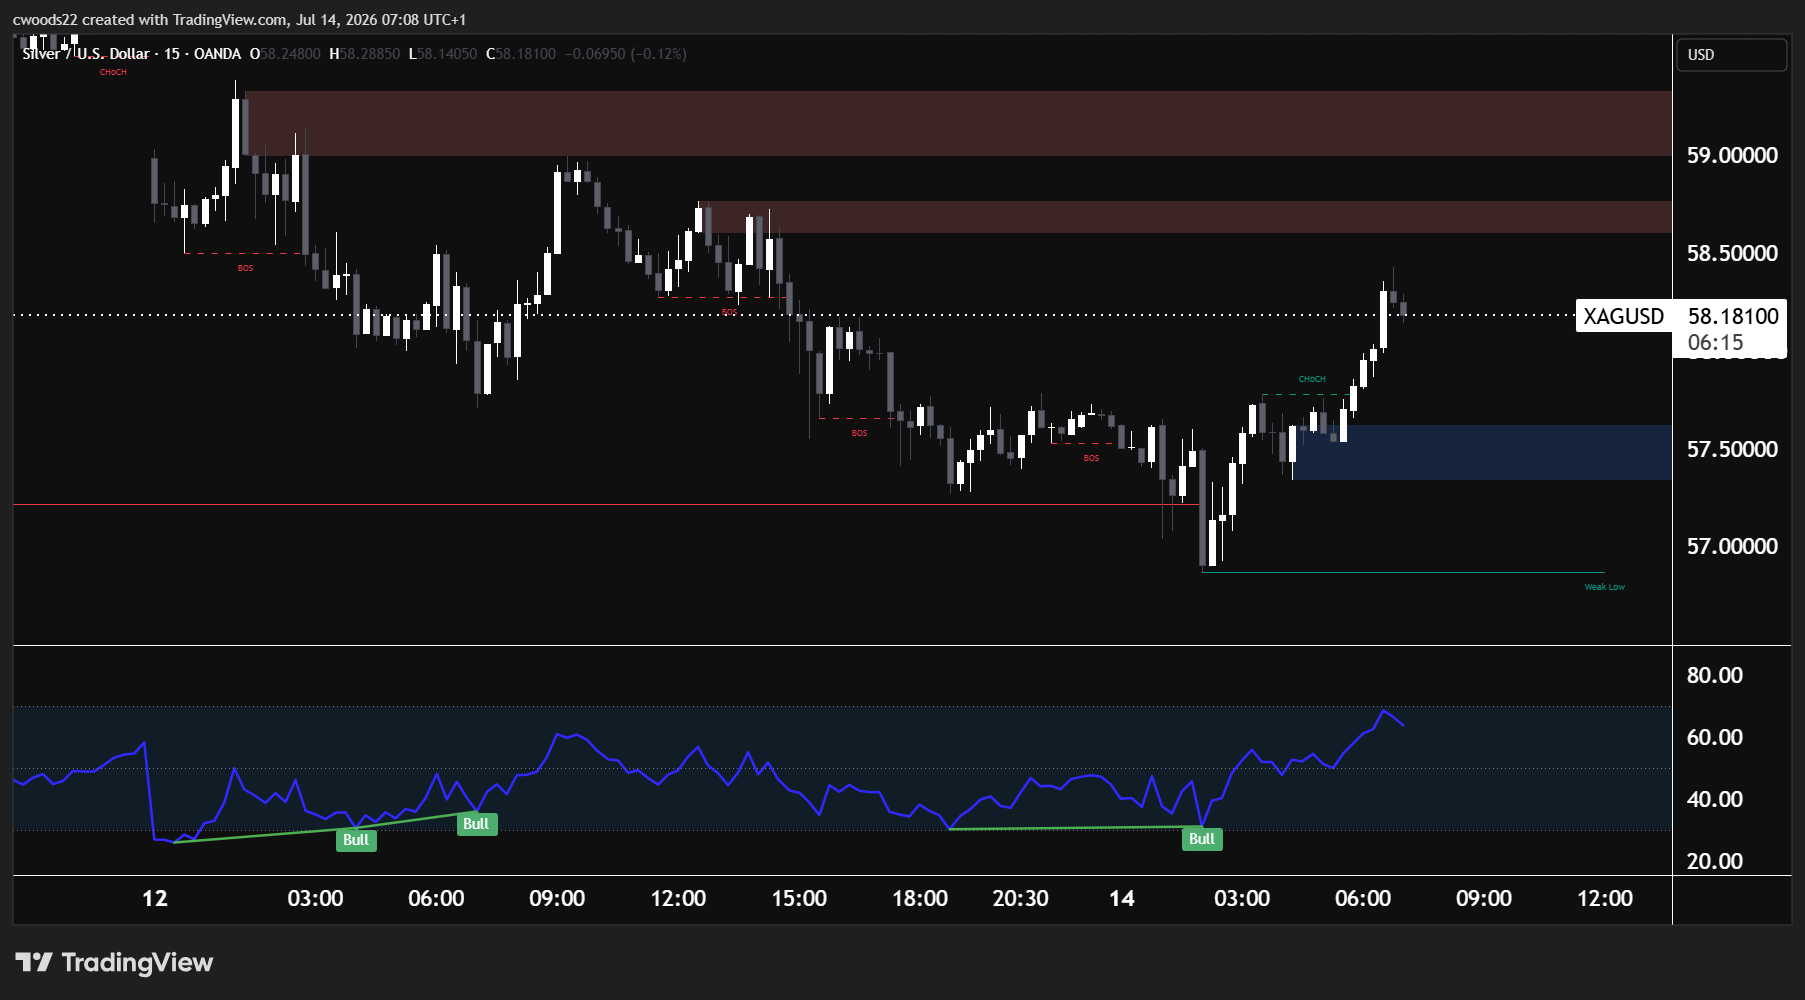
Chart: Silver, 15min timeframe (TradingView, SMC)
The 15 minute chart shows silver completing a sell off from above 59.00 to the demand zone near 57.00 to 57.50 (the blue shaded area). The initial decline was clean: a bearish change of character at the top left of the chart near 59.00 set the tone, and a series of break of structure moves at 58.50, 58.00, and 57.50 confirmed that sellers were in control.
The reversal signals appeared at exactly the right place. Two bull RSI divergences formed at the lows: the first near 57.50 and the second near 57.00 to 57.20. Price made lower lows while RSI made higher lows, a classic signal that selling pressure was exhausting. The subsequent bullish change of character above 57.50 confirmed the structural shift, and price has since recovered to 58.18.
The entry zone sits between 57.80 and 58.20, which is the current price area and represents the space between the confirmed change of character and the supply zone above. The first target is 58.50, where the supply zone begins and where sellers previously established control. The extended target is 59.00, the upper edge of the supply zone and the level where the initial sell off started. Invalidation sits below 57.00, where a break beneath the low would suggest the demand zone has failed.
The macro trigger is today’s US CPI release. Silver is priced in dollars, which means a soft inflation print (below the expected 3.8%) would weaken the dollar and provide a direct tailwind for this trade. Conversely, a hot print above 4.0% would strengthen the dollar and pressure silver back toward demand. Fed Chair Kevin Warsh’s congressional testimony today adds a second layer of event risk.
Trade 2: GBP/USD Long from Equal Lows
| Pair | Direction | Entry Zone | Target 1 | Target 2 | Invalidation |
| GBP/USD | Long | 1.3340 to 1.3370 | 1.3400 | 1.3440 | Below 1.3320 |
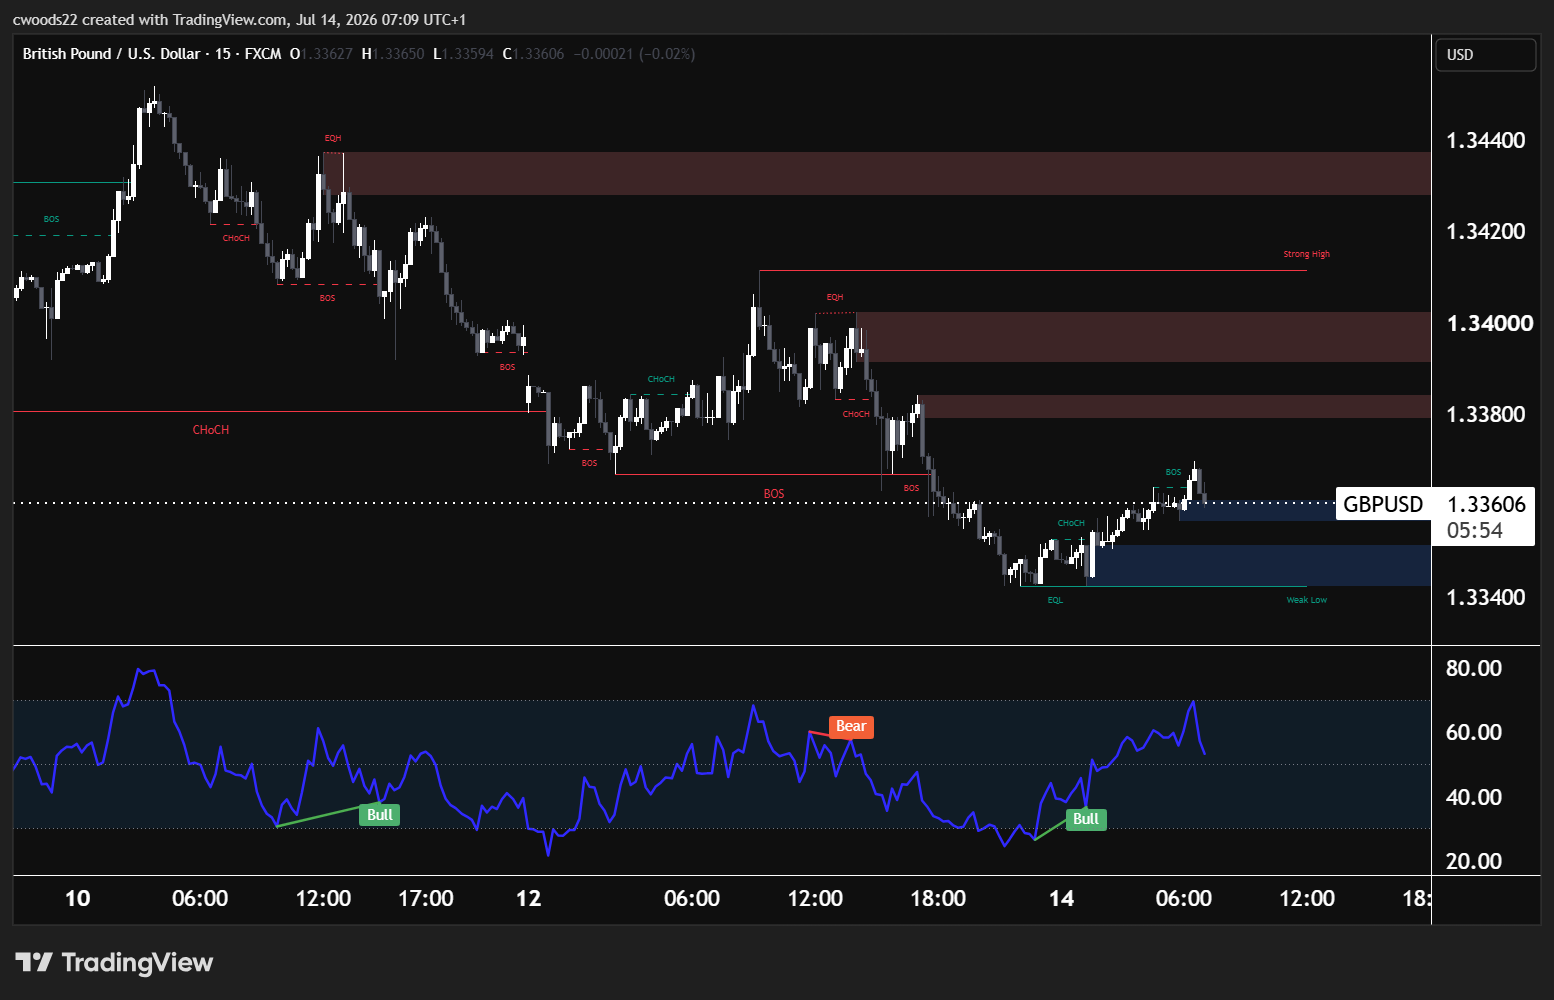
Chart: GBP/USD, 15min timeframe (TradingView, SMC)
GBP/USD has sold off from 1.3440 to the equal lows at 1.3340, and the 15 minute chart shows the early stages of a recovery. The decline was structured: a bearish change of character at 1.3420 was followed by a series of break of structure moves through 1.3400, 1.3380, and 1.3360. A bear RSI divergence appeared mid chart around the 1.3380 to 1.3400 area, confirming that the rally had lost momentum before the sell off accelerated.
The demand zone between 1.3330 and 1.3360 is where buyers stepped in. The equal lows near 1.3340 represent a liquidity zone, and the bull RSI divergence at the lows signals that the selling pressure has faded. A bullish change of character and break of structure above 1.3360 on July 14 confirms that buyers have retaken short term control.
The entry zone is 1.3340 to 1.3370 (current area and any pullback to the confirmed structure). The first target is 1.3400, which represents the previous break of structure level that should now act as resistance. The extended target is 1.3440, the high and upper supply zone. Invalidation sits below 1.3320, where a clean break would suggest the equal lows have been swept and the bearish trend is continuing.
The pound’s fundamentals are relatively stable. UK inflation is running at 2.8% year on year, markets are pricing a Bank of England rate hike by December, and the next UK CPI release (July 22) is still a week away. This means the primary driver for GBP/USD today is the US side: the CPI release at 13:30 UK time. A softer inflation print would ease dollar strength and give GBP/USD the room to push back toward 1.3400 and potentially 1.3440.
Trade 3: BTC/USD Long from Demand
| Pair | Direction | Entry Zone | Target 1 | Target 2 | Invalidation |
| BTC/USD | Long | 62,200 to 62,600 | 62,800 | 63,200 | Below 61,800 |
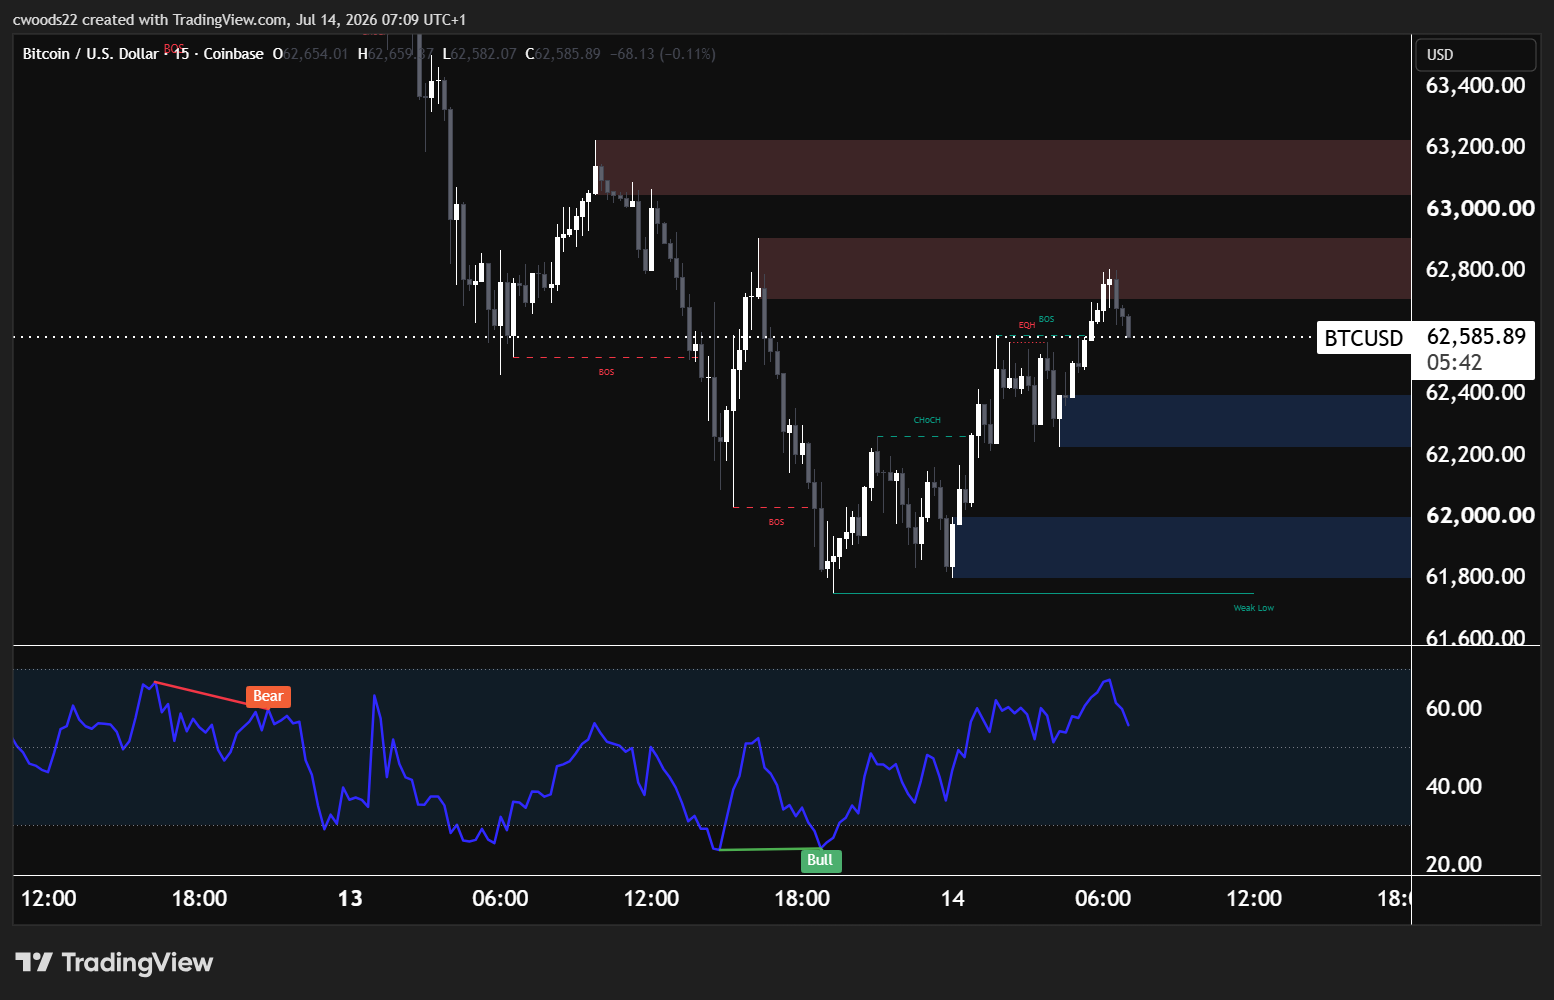
Chart: BTC/USD, 15min timeframe (TradingView, SMC)
Bitcoin’s 15 minute chart shows a clear cycle. Price rallied from approximately 62,600 to above 63,200 on July 13, but a bear RSI divergence at the top (price making higher highs while RSI made lower highs) warned that the push lacked conviction. The sell off that followed was swift, taking price through a series of bearish break of structure and change of character moves down to the demand zone near 62,000.
The recovery from demand is textbook. A bull RSI divergence at the lows near 62,000 signalled that the selling was exhausting, and the subsequent bullish change of character at 62,300 to 62,400 followed by a break of structure at 62,600 confirmed the reversal. Price now sits at 62,585, positioned between the confirmed break of structure level and the supply zone between 62,800 and 63,200 (the red shaded area).
The entry zone is 62,200 to 62,600 (current area or a pullback toward the demand). The first target is 62,800, the lower edge of the supply zone. The extended target is 63,200, the top of the supply zone where the previous high sits. Invalidation is below 61,800, where a break beneath the low would negate the bullish structure and open a move toward deeper demand.
The ETF picture has improved. After June’s record $4.06 billion in outflows, early July saw $510 million in inflows across three sessions. Citigroup’s research shows that each $100 million in net ETF inflows correlates with roughly 53 basis points of same day price appreciation. If today’s CPI print comes in soft and the dollar weakens, the resulting risk on sentiment could drive another round of ETF inflows and give Bitcoin the fuel to test the supply zone. A hot CPI print would have the opposite effect, sending Bitcoin back toward demand as rate hike expectations firm up.
Risk Warning: Trading financial instruments, particularly those involving leverage, involves a substantial degree of risk and is not appropriate for all investors. The value of your investments can rise or fall sharply, and it is possible to lose the entirety of your invested capital. Do not trade with funds you cannot afford to lose. Nothing in this site should be read or construed as constituting advice on the part of Taurex or any of its affiliates, directors, officers or employees.