
Key Points
- Oil has crashed over 13% in a week, falling from $92 to below $80 after reports that the United States and Iran are close to a deal to reopen the Strait of Hormuz. The H4 chart shows a bearish structural shift at the $80 level, with a significant supply zone between $88 and $92 now acting as overhead resistance and demand sitting at $72 and $68.
- EUR/USD has rallied to 1.15350 and is approaching the top of its recent range near 1.15500. A bullish structural break confirms the short term trend, but Friday’s Non Farm Payrolls report (forecast 88K) will determine whether the pair has enough momentum to push through resistance or pulls back toward the 1.13800 demand zone.
- This week builds toward Friday with a string of US labour market data: ISM Manufacturing today, JOLTS on Tuesday, ADP on Wednesday, and NFP plus the unemployment rate on Friday. After the Fed’s hawkish hold last week (three members dissented in favour of a rate hike), any weakness in jobs data could shift the narrative toward rate cuts and weigh on the dollar.
A Week of Aftershocks
Last week delivered two major headlines. The Federal Reserve held rates at 3.50% to 3.75% in a 9 to 3 vote, with three members (Hammack, Kashkari, and Logan) dissenting in favour of a 25 basis point hike. Chair Warsh described the split as a “family fight” and warned that the Fed “will not hesitate” to raise rates further if inflation remains sticky. The Dow fell over 1,100 points on the day, and markets are now pricing in two more potential hikes before year end.
Oil added to the chaos. WTI crude had been trading near $92 on the back of months of Strait of Hormuz disruption, with Iran effectively controlling shipping through the world’s most important oil chokepoint. Then reports emerged that President Trump was close to a deal with Iran to reopen the strait. Oil prices collapsed, falling over 13% in a matter of days to settle near $80. Iran has denied that any formal agreement exists, but the market has already priced in a significant probability of resolution.
The Bank of Japan held rates at 1.00% in an 8 to 1 vote, with board member Takata dissenting in favour of a hike to 1.25%. Governor Ueda signalled that a rate increase could come as soon as September. The yen saw dramatic intervention on Thursday, spiking from around 162.80 to 157 in the space of an hour as Japanese financial authorities stepped in to defend the currency.
With all of that as the backdrop, this week’s focus shifts to the US labour market. A string of employment data builds toward Friday’s Non Farm Payrolls, and after the Fed’s hawkish tone, these numbers carry extra weight.
WTI Crude Oil: The Hormuz Gamble
The oil story has been the defining narrative of 2026. The Strait of Hormuz carries roughly 20% of the world’s oil supply, and when Iran disrupted shipping earlier this year, WTI rallied from the mid $60s to above $90. That rally unwound in spectacular fashion last week.
The H4 chart tells a clear story. Oil peaked near $92 in late July and has since broken through a series of lower highs, confirming a bearish structural shift at the $80 level. Two bear RSI divergences formed at the $84 to $88 highs before the selloff accelerated, signalling that buying momentum was fading even as price pushed higher.
The supply zone between $88 and $92 now represents the area where sellers took control. Any bounce back into that zone is likely to attract fresh selling interest. On the downside, demand sits at $72 and then $68, levels where buyers stepped in during the June rally.
The fundamental picture depends entirely on the Hormuz negotiations. Trump has claimed a deal is close, but Iran’s Foreign Ministry has denied any agreement exists. Pakistan and China have both been involved in mediation efforts. If a credible deal materialises and shipping through the strait resumes, oil could fall toward the $68 to $72 demand area as the geopolitical risk premium unwinds. If talks collapse or Iran escalates again, the $88 to $92 supply zone comes back into play quickly.
For now, oil is sitting right at the structural tipping point. The $80 level marks the bearish shift on the chart, and a sustained break below it opens the door for a deeper correction. The Hormuz situation can move oil by several dollars in either direction within hours, so this is a week to watch the headlines as closely as the charts.
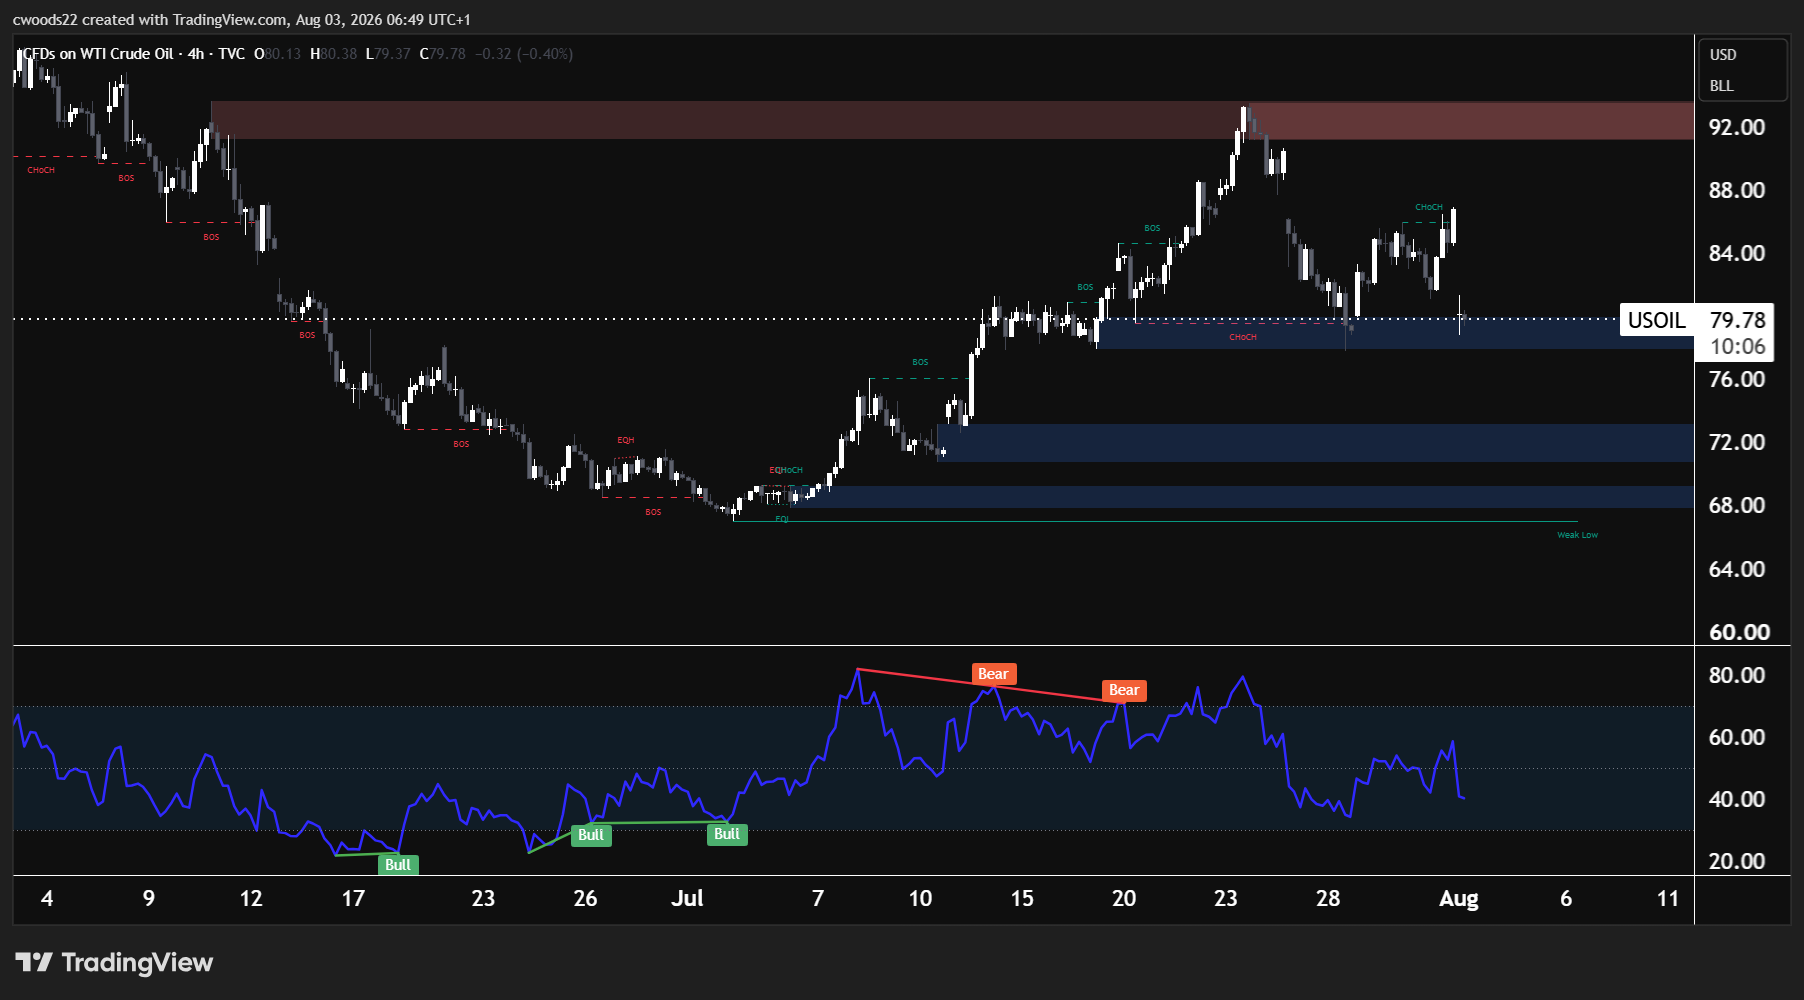
Chart: WTI Crude Oil, H4 timeframe (TradingView, SMC)
EUR/USD: All Roads Lead to Payrolls
EUR/USD has been quietly building a bullish case over the past two weeks. After sweeping equal lows near 1.13500 in late July, the pair has rallied strongly to 1.15350, breaking through structural resistance and printing a clean bullish break of structure along the way.
The H4 chart shows demand established between 1.13800 and 1.14000, confirmed by a bull RSI divergence at the late July lows. The rally from that zone has been steady, with higher highs and higher lows forming the foundation of a short term uptrend. Price is now approaching the top of the range near 1.15500, which acts as the next significant level to watch.
The fundamental driver this week is Friday’s Non Farm Payrolls report. Last month’s reading came in at 57K, a significant miss against the 110K forecast and well below the revised 129K figure from May. The US labour market is clearly cooling, and this week’s data will tell us how quickly.
The forecast for Friday is 88K, an improvement from the June print but still modest by historical standards. ADP employment on Wednesday (forecast 71K, previous 98K) will provide an early read on the private sector, and JOLTS job openings on Tuesday (forecast 7.42M, previous 7.59M) will show whether companies are pulling back on hiring plans.
If NFP comes in weak again, it adds pressure on the Fed to reconsider its hawkish stance. Rate hike expectations could ease, the dollar would likely weaken, and EUR/USD could push through the 1.15500 level toward 1.16000. If the number surprises to the upside and shows the labour market is more resilient than feared, the dollar could strengthen and push EUR/USD back toward the 1.14000 demand zone.
The setup is straightforward: a bullish structure on the chart meets a major fundamental catalyst on Friday. Which way this resolves depends almost entirely on the payrolls number.
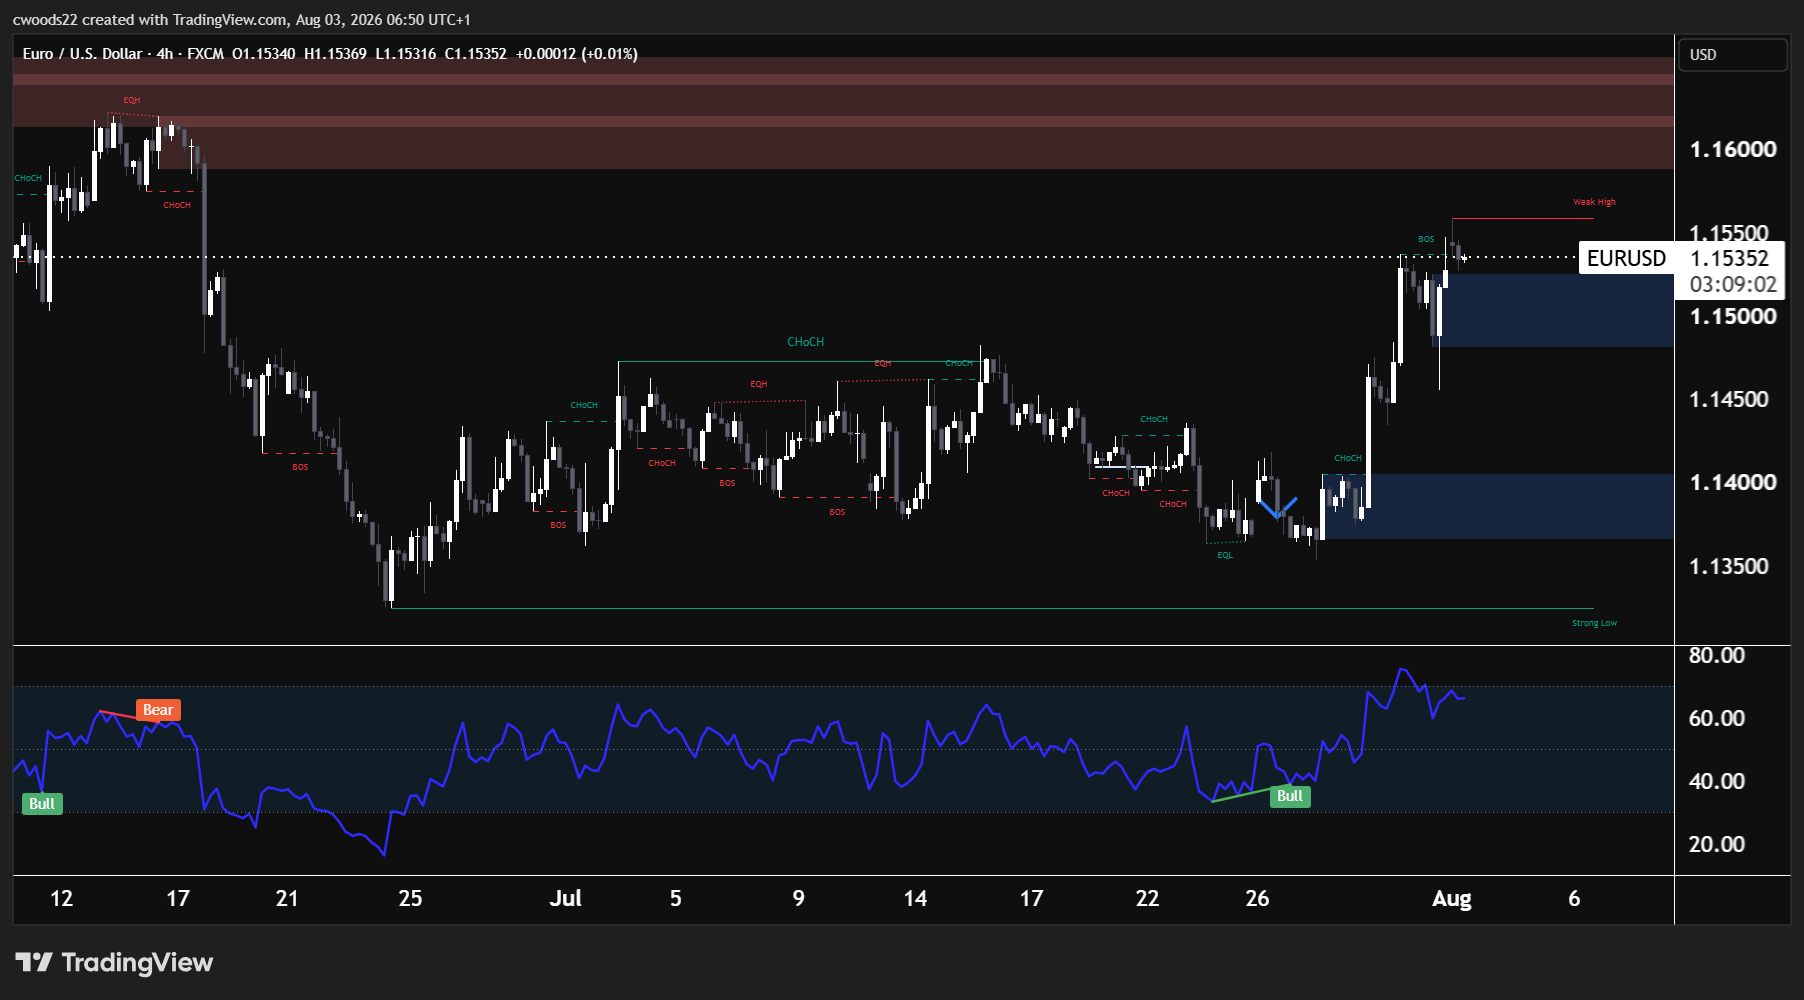
Chart: EUR/USD, H4 timeframe (TradingView, SMC)
Key Events This Week
All times shown in UTC. High and medium impact events only.
| Day | Time (UTC) | Event | Forecast | Previous |
| Mon 3 Aug | 14:00 | ISM Manufacturing PMI (USD) | 54.0 | 53.3 |
| Tue 4 Aug | 14:00 | JOLTS Job Openings (USD) | 7.42M | 7.59M |
| Wed 5 Aug | 12:15 | ADP Employment Change (USD) | 71K | 98K |
| Wed 5 Aug | 14:00 | ISM Services PMI (USD) | 54.5 | 54.0 |
| Thu 6 Aug | 12:30 | Unemployment Claims (USD) | 205K | 197K |
| Fri 7 Aug | 12:30 | Non Farm Payrolls (USD) | 88K | 57K |
| Fri 7 Aug | 12:30 | Unemployment Rate (USD) | 4.2% | 4.2% |
| Fri 7 Aug | 12:30 | Average Hourly Earnings m/m (USD) | 0.3% | 0.3% |
Risk Warning: Trading financial instruments, particularly those involving leverage, involves a substantial degree of risk and is not appropriate for all investors. The value of your investments can rise or fall sharply, and it is possible to lose the entirety of your invested capital. Do not trade with funds you cannot afford to lose. Nothing in this site should be read or construed as constituting advice on the part of Taurex or any of its affiliates, directors, officers or employees.