
Key Points
- Bitcoin has broken above $80,000 for the first time since mid May, rallying 23% over the past seven days, the steepest weekly gain in roughly three years. The H1 chart shows price pressing directly into the weak high at $81,500, with a demand zone between $78,500 and $79,300 offering the pullback entry for the next leg higher.
- Gold continues its relentless climb toward the $4,700 weak high, trading at $4,646 without a single meaningful change of character since late July. A demand zone has formed between $4,600 and $4,625 as price consolidates just beneath the highs, offering a potential entry for continuation into Jackson Hole week.
- The DAX has recovered sharply from the 25,910 low through consecutive breaks of structure and is now pressing directly into the 26,200 weak high, trading at 26,193.5. A pullback into the 26,080 to 26,120 demand zone could offer the entry for a breakout attempt above the weak high toward fresh highs.
Trade 1: Bitcoin Long from Demand
| Pair | Direction | Entry Zone | Target 1 | Target 2 | Invalidation |
| BTC/USD | Long | $78,800 to $79,300 | $81,000 | $82,000 | Below $78,000 |
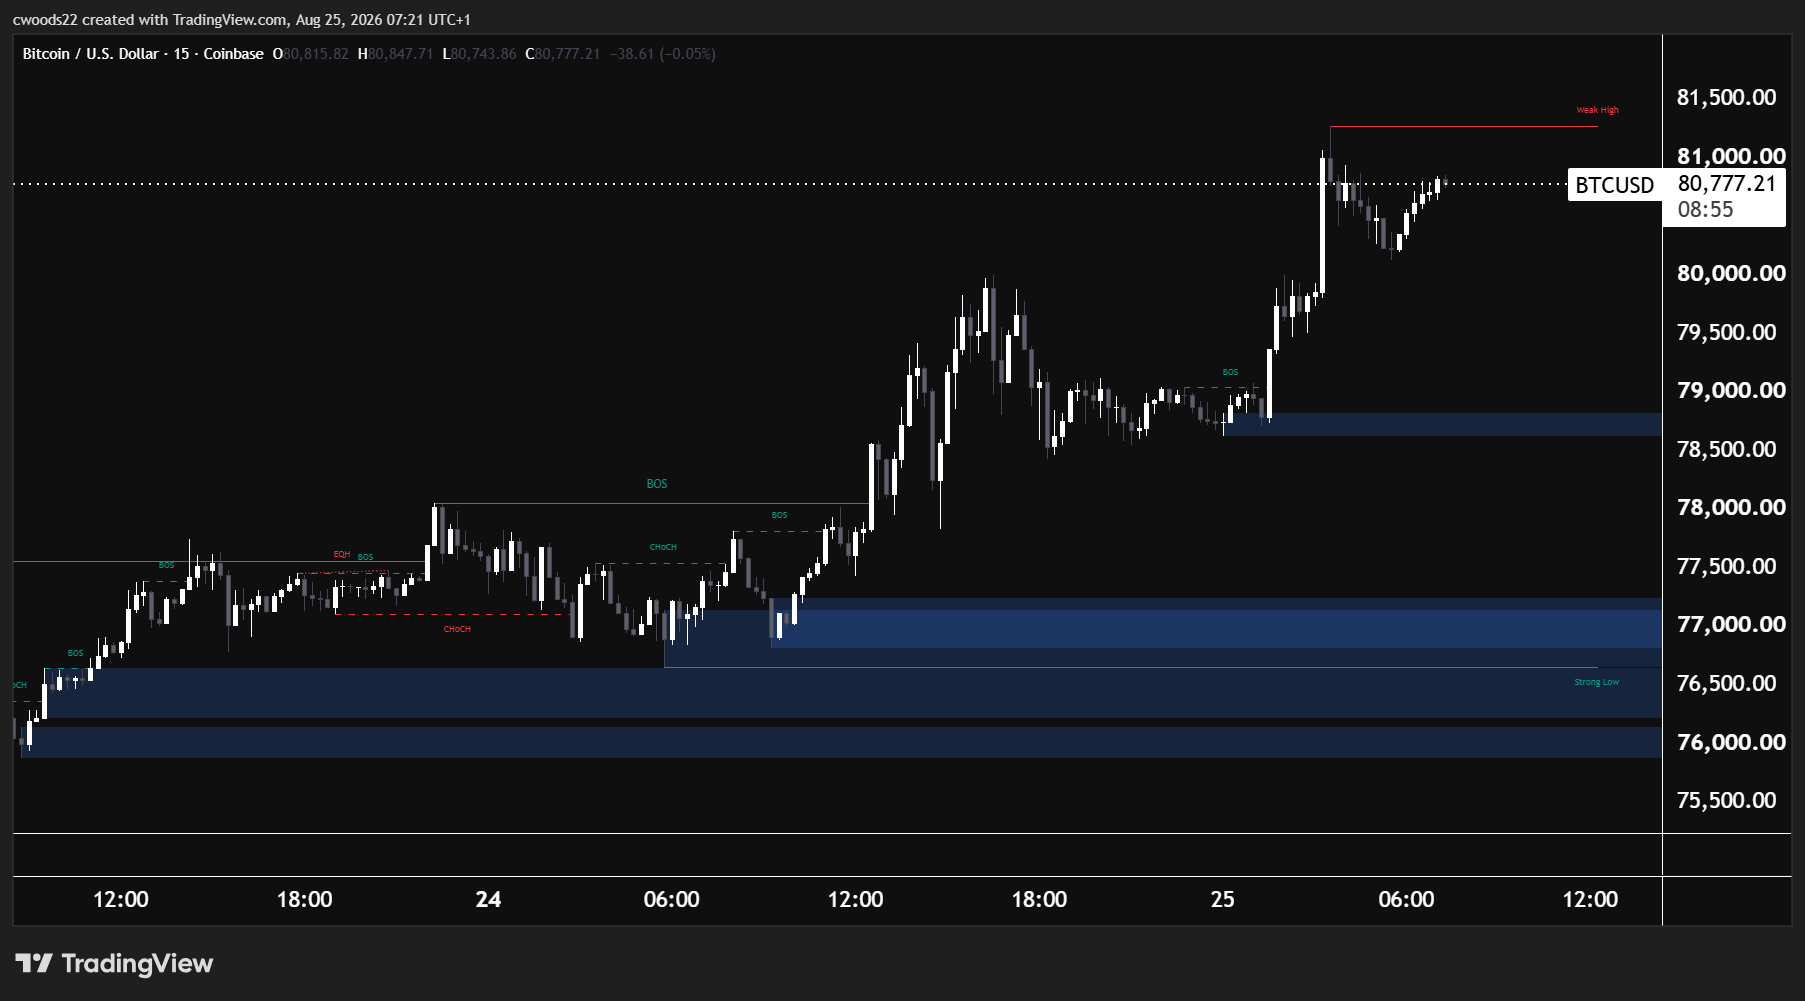
Chart: BTC/USD, 15 minute timeframe (TradingView, SMC)
Bitcoin’s move through $80,000 is the standout story in markets this week. The H1 chart shows a market that spent the early part of the week consolidating between $76,500 and $78,500 before a sharp break of structure carried price through $79,000 and then $80,000 in quick succession. Price is now at $80,777, pressing directly into the weak high at $81,500, the upper boundary of Bitcoin’s trading range going back to May.
The move has been driven by a wave of short liquidations as bullish momentum accelerated, part of a broader 23% weekly rally that is the steepest in roughly three years. Bitcoin is now around 38% higher than its late June low below $58,000, a steady recovery that has quietly rebuilt confidence across the wider crypto market even though price remains well below the October all time high near $126,000.
The trade looks for a pullback into the $78,800 to $79,300 demand zone, where the most recent break of structure originated. This is the area buyers defended before the final push through $80,000, making it the highest probability zone for a continuation entry. Target 1 is $81,000, just below the weak high, with Target 2 at $82,000 for those looking to ride a confirmed breakout further. Invalidation sits below $78,000, where a break would suggest the rally is losing steam rather than pausing.
Bitcoin’s correlation with broader risk sentiment remains elevated, so this week’s US data, including Wednesday’s Core PCE and Friday’s Jackson Hole address from Fed Chair Warsh, could easily be the swing factor for whether the breakout extends or stalls at the weak high.
Trade 2: Gold Long into the Weak High
| Pair | Direction | Entry Zone | Target 1 | Target 2 | Invalidation |
| XAU/USD | Long | $4,600 to $4,625 | $4,700 | $4,725 | Below $4,575 |
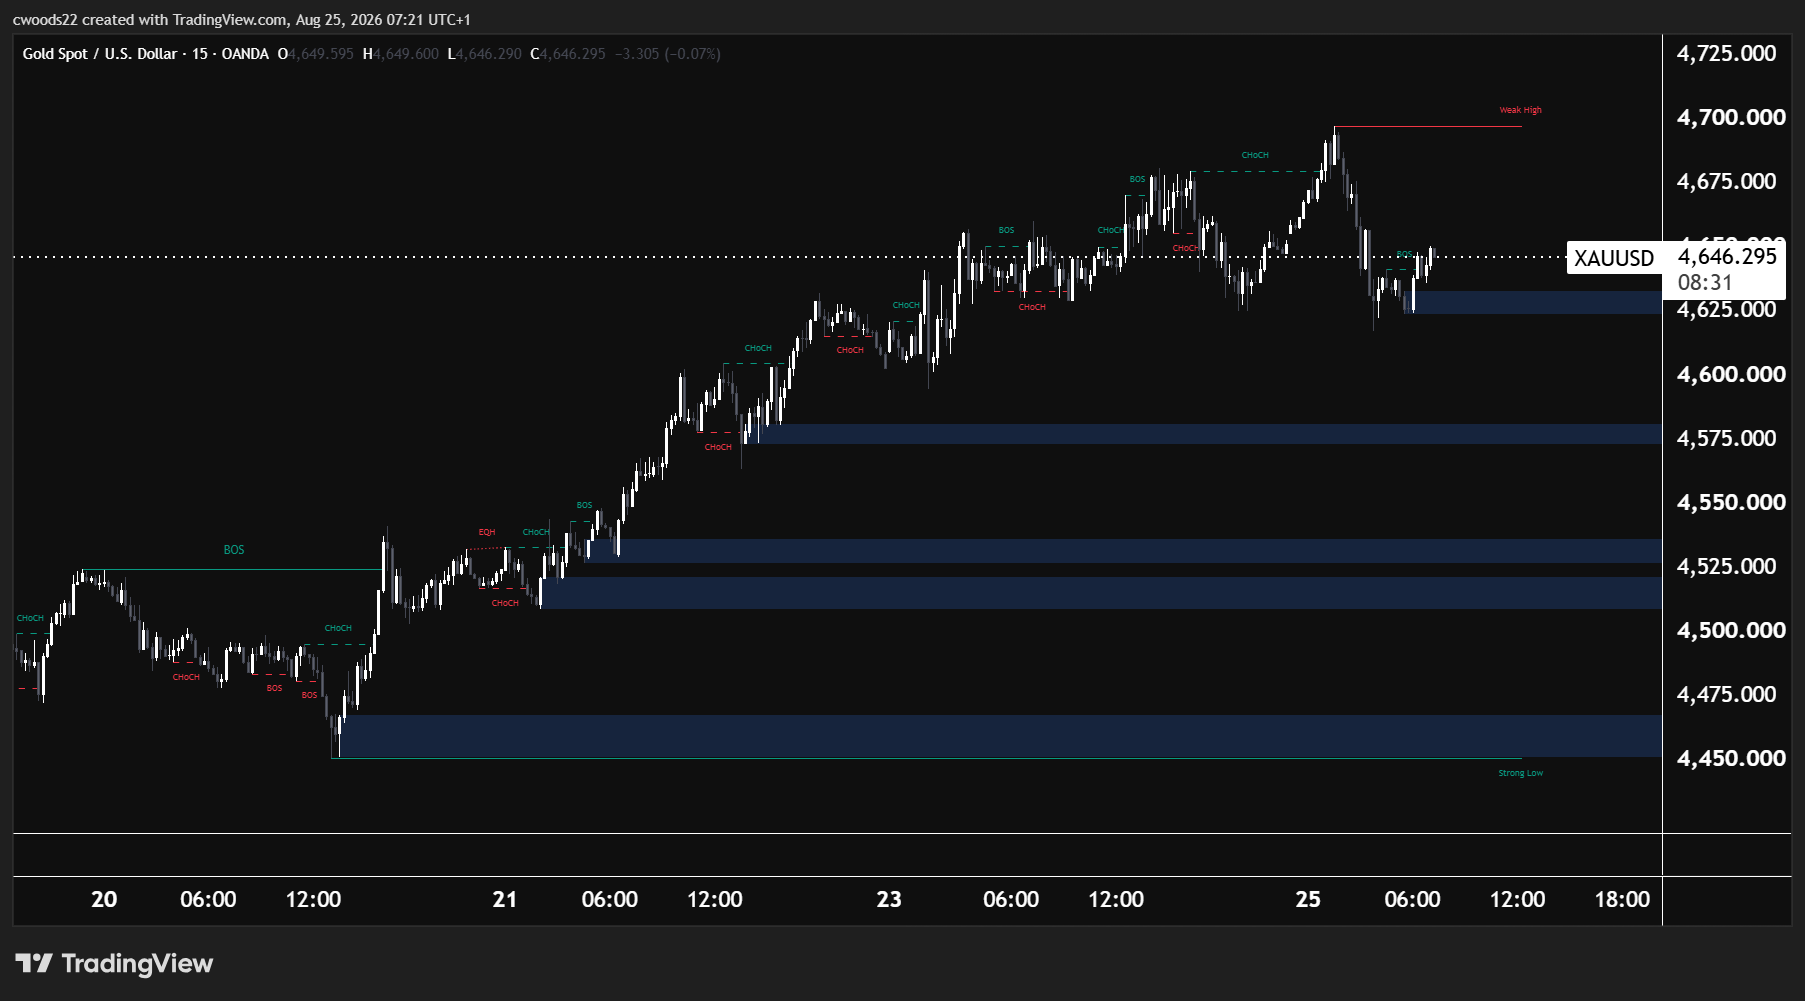
Chart: XAU/USD, 15 minute timeframe (TradingView, SMC)
Gold’s advance has been one of the cleanest trending moves on the board. The H1 chart shows a sequence of breaks of structure carrying price from the $4,000 strong low through $4,300, $4,400 and now toward the $4,700 weak high, with barely a meaningful change of character to interrupt the climb. Price currently sits at $4,646, consolidating just beneath the highs after tagging the weak high area earlier in the session.
A demand zone has formed between $4,600 and $4,625 as this consolidation develops, the level where the most recent leg higher found its footing. This gives the setup a clean structural reference point rather than trading directly at resistance. Target 1 is $4,700, the weak high itself, with Target 2 at $4,725 for a confirmed break higher. Invalidation sits below $4,575, a level that would suggest the consolidation is turning into a deeper pullback rather than a pause before continuation.
The fundamental backdrop remains firmly supportive. US 30 year yields are still sitting near multi decade highs, yet gold keeps climbing rather than falling, a continuation of the correlation breakdown covered in this week’s Coffee and Charts. With Jackson Hole landing on Friday and the market still uncertain how Fed Chair Warsh will address the elevated long end of the curve, safe haven demand looks unlikely to fade before then.
Trade 3: DAX (GER40) Long from Demand
| Pair | Direction | Entry Zone | Target 1 | Target 2 | Invalidation |
| GER40 | Long | 26,080 to 26,120 | 26,300 | 26,400 | Below 26,000 |
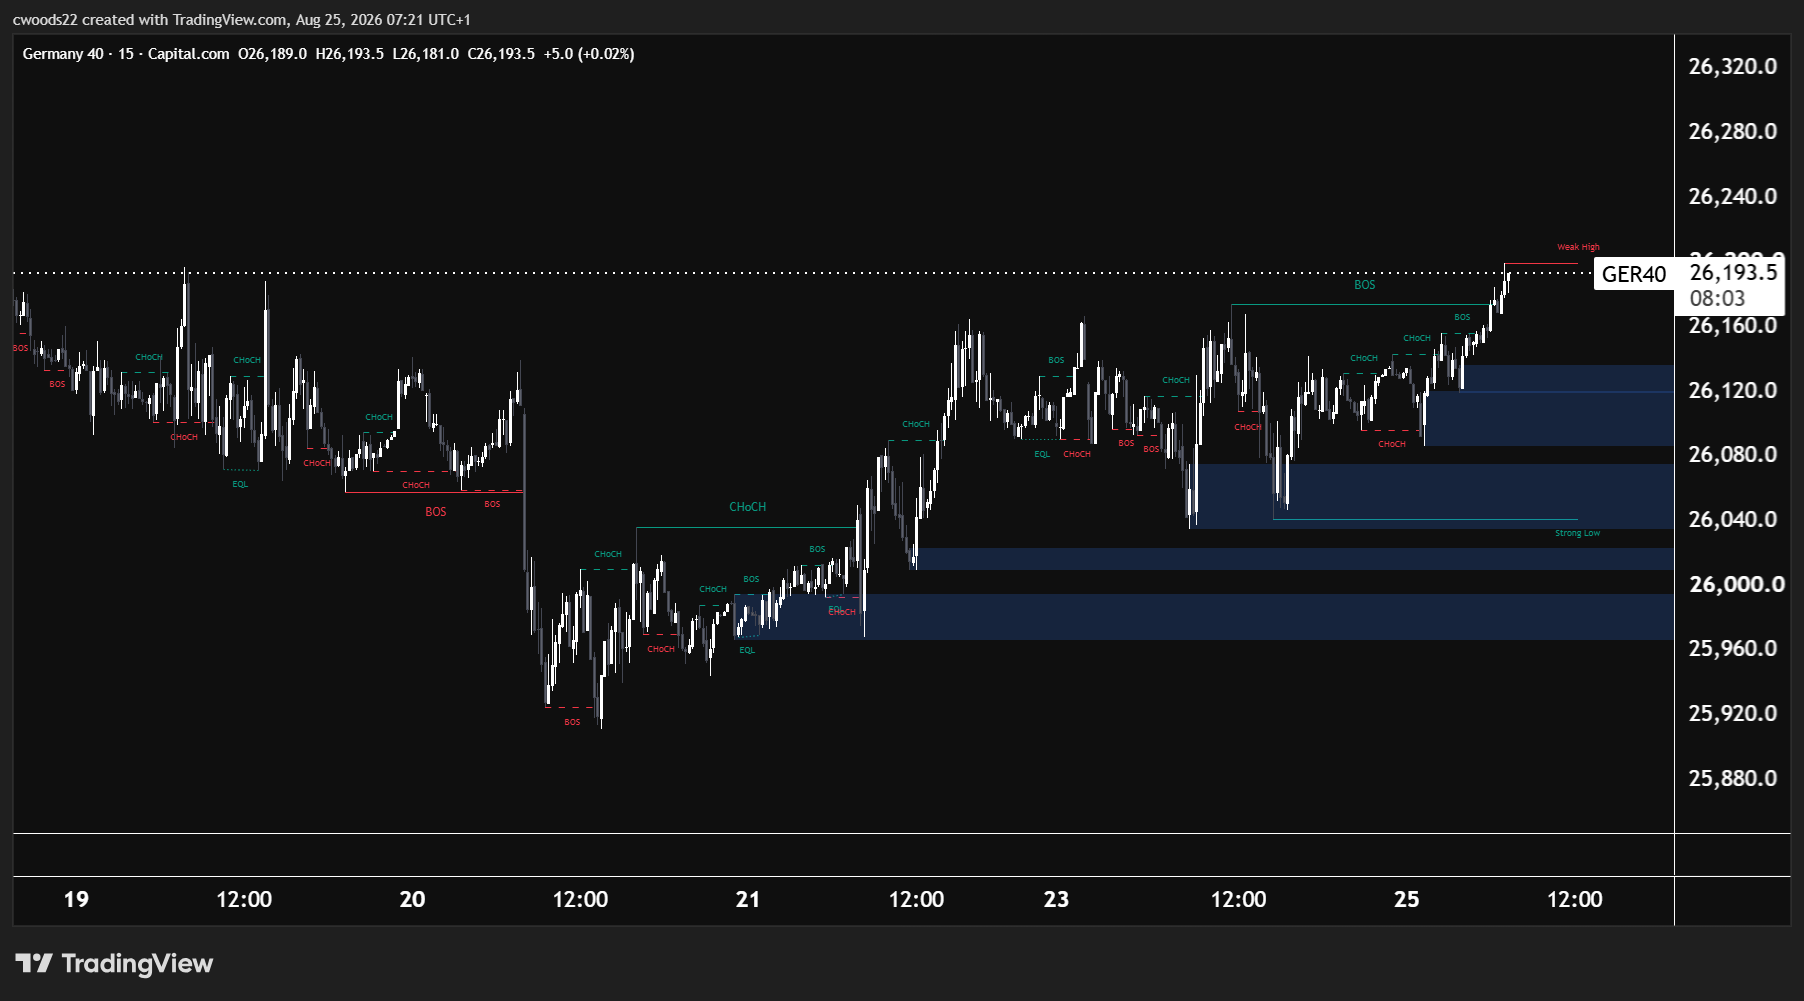
Chart: DAX (GER40), 15 minute timeframe (TradingView, SMC)
The DAX has staged an impressive recovery on the H1 chart, rallying from the 25,910 low through a clean sequence of changes of character and breaks of structure to reach 26,193.5, just pips from the weak high at 26,200. Every pullback during the climb has been shallow, a sign that buyers have been in control since the reversal began.
The trade looks for a retracement into the 26,080 to 26,120 demand zone, the level where the most recent break of structure originated before the final push into the weak high. This offers a cleaner entry than chasing price directly at resistance. Target 1 is 26,300, with Target 2 at 26,400 for a confirmed break above the weak high. Invalidation sits below 26,000, close to the strong low that underpins the entire recovery structure.
European equities have been catching a bid alongside the broader risk on tone this week, though the energy backdrop remains a swing factor for German manufacturers given the lingering Iran and Hormuz situation. With Jackson Hole and a heavy US data slate landing later in the week, the DAX’s ability to clear 26,200 may depend as much on the dollar and global risk sentiment as it does on domestic European catalysts.
Risk Warning: Trading financial instruments, particularly those involving leverage, involves a substantial degree of risk and is not appropriate for all investors. The value of your investments can rise or fall sharply, and it is possible to lose the entirety of your invested capital. Leveraged products, in particular, amplify both potential gains and losses. Before engaging in such trading, you must assess your financial goals, experience level, and appetite for risk. It is your sole responsibility to ensure that you understand the mechanics and risks of trading, including margin requirements, and to seek independent financial advice where appropriate. Do not trade with funds you cannot afford to lose. Nothing in this site should be read or construed as constituting advice on the part of Taurex or any of its affiliates, directors, officers or employees.