


All major U.S. stock indices rose last year, with the S&P 500 increasing by approximately 24% for the second consecutive year, the NASDAQ 100 up by about 26%, the Dow Jones by 13%, and the Russell 2000 for small and mid-cap stocks by around 10%.
Performance of U.S. Stock Indices in Recent Days:
U.S. stock indices closed with modest gains two days ago: the S&P 500 (+0.16%) and NASDAQ 100 (+0.04%), and it seems that the positive momentum for these indices is continuing into this year, despite the significant risks and challenges that U.S. stocks may face. These include:
- Rising U.S. Treasury Yields:S. Treasury yields have risen, particularly the 10-year bond yields, which recorded 4.73% two days ago, the highest level since April 25, 2024. This increase has put pressure on high-risk assets such as stocks and cryptocurrencies, with expectations that yields could reach 5%, the level seen in October 2023. This is especially true with ongoing inflationary pressures and uncertainty regarding the fiscal, economic, and trade policies of President Donald Trump.
- Hawkish Federal Reserve Statements: There have been cautious and hawkish statements from most Federal Reserve members, along with the December Federal Reserve minutes, which called for caution in reducing interest rates amidst rising inflation risks. This comes amid strong economic growth of 3.1%, supported by consumer spending, which represents 70% of the economy, as well as a resilient labor market, with unemployment claims falling below expectations for four consecutive weeks.
- Geopolitical and Trade Tensions: Markets are closely monitoring current tensions between the Trump administration and Panama, Greenland, and Canada, with concerns about the potential for these tensions to escalate or new tensions to emerge. Additionally, trade tensions between China and the U.S. continue to pose risks.
- Biden Administration’s Export Restrictions on Advanced Chips: The Biden administration plans to impose new restrictions on the export of advanced chips for artificial intelligence, such as those produced by NVIDIA, to prevent the technology from reaching China and Russia.
Supporting Factors for U.S. Stocks:
Despite the pressures on U.S. stocks, there are several supporting factors, including:
- Ongoing Demand for AI and Chips: The demand for AI-related products and chips continues, with expectations for the AI sector to grow by 35% this year. Additionally, Microsoft’s CEO plans to invest $80 billion in AI data centers.
- Strong Performance in the Banking Sector: The banking sector performed well last year, with the KBW Bank Index rising by about 34%, outperforming the S&P 500 and NASDAQ 100 indices. There are expectations for the positive momentum to continue in banking stocks this year.
- Support for Domestic Industry: Trump has pledged support for domestic industry in the U.S. and committed to reducing corporate taxes, which is expected to have a positive impact on the performance of stocks in the industrial sector.
Markets Await U.S. Jobs Report:
Markets are closely watching the U.S. non-farm payrolls report, unemployment rate, and hourly wage growth at 17:30 UAE time today. The expectations are that the U.S. economy will add 164,000 new jobs in December, following the addition of 224,000 jobs in November. The unemployment rate is expected to remain steady at 4.2%. Finally, analysts expect the year-over-year hourly wage growth to be 4.0%, which aligns with the previous reading.
Technical Analysis of the S&P 500 Index:
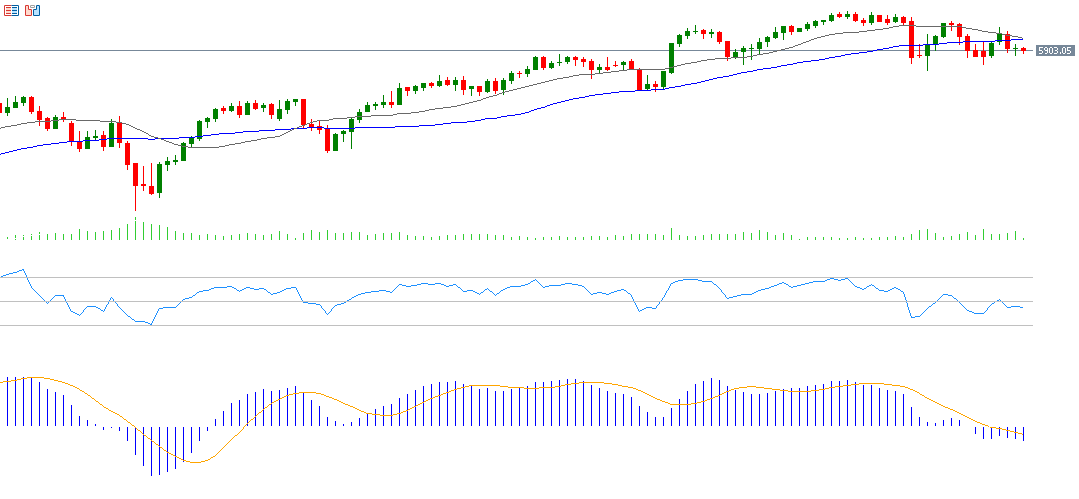
From a technical perspective, the S&P 500 index is trading below the 20-day moving average (gray line) at 5,972 points, and also below the 50-day moving average (blue line) at 5,952 points. The 200-day moving average at 5,570 points remains a strategic support level. Any bearish break of this support could lead to a continued downward trend for the S&P 500 index. The Relative Strength Index (RSI) currently stands at 46 points, indicating bearish momentum for the index. The MACD indicator shows a bearish crossover between the blue MACD line and the orange Signal Line, further indicating negative momentum for the S&P 500.
Please note that this analysis is provided for informational purposes only and should not be considered as investment advice. All trading involves risk.



