Key Points
- EUR/USD has recovered from June’s lows near 1.1350 to 1.1437 after last week’s US CPI miss (3.5% versus 3.8% expected) weakened the dollar. The H4 chart shows a bull RSI divergence at the lows and a series of bullish change of character and break of structure confirmations on the recovery. The ECB decision on Thursday is expected to be a hold at 2.25%, but the guidance around a potential September hike will set the tone for whether the euro can push through the high near 1.1510.
- WTI crude oil has surged 24% from the $68 lows to $84.08 after the Iran ceasefire collapsed on July 8 and the Strait of Hormuz was re-closed. Three bull RSI divergences formed at the lows before the breakout, and the rally has now carried price through multiple break of structure levels. A bear RSI divergence appeared mid-rally near the $77 to $80 area, a warning that momentum is stretched, but the war premium remains the dominant driver. Supply between $88 and $92 is the next structural test.
- Flash PMIs on Friday from the US, Eurozone, UK, and Germany will provide the first read on July economic activity. Eurozone services were still in contraction in June at 48.9, while US services edged higher to 51.3. These numbers will be particularly important for the euro, as weak eurozone growth undermines the case for the ECB to tighten again in September.
Last Week in Review
Last week’s US CPI report was the headliner, and it delivered a significant surprise to the downside. Headline inflation fell 0.4% month on month in June, bringing the annual rate down to 3.5% from 4.2% in May. That was well below the 3.8% consensus forecast and marked the biggest monthly decline since April 2020. Core inflation (excluding food and energy) was flat on the month, pulling the year on year rate to 2.6% from 2.9%. The sharp decline was driven largely by falling energy prices, which briefly retreated in June following the initial Iran ceasefire before surging again after it collapsed.
Fed Chair Kevin Warsh testified before Congress on Tuesday and Wednesday. In keeping with his decision to abandon the Fed’s tradition of telegraphing its next move, Warsh offered no hints about whether the next step will be a hike, a hold, or a cut. He acknowledged that the latest inflation data was “encouraging” but said it did not represent “mission accomplished.” The federal funds rate remains at 3.50% to 3.75%.
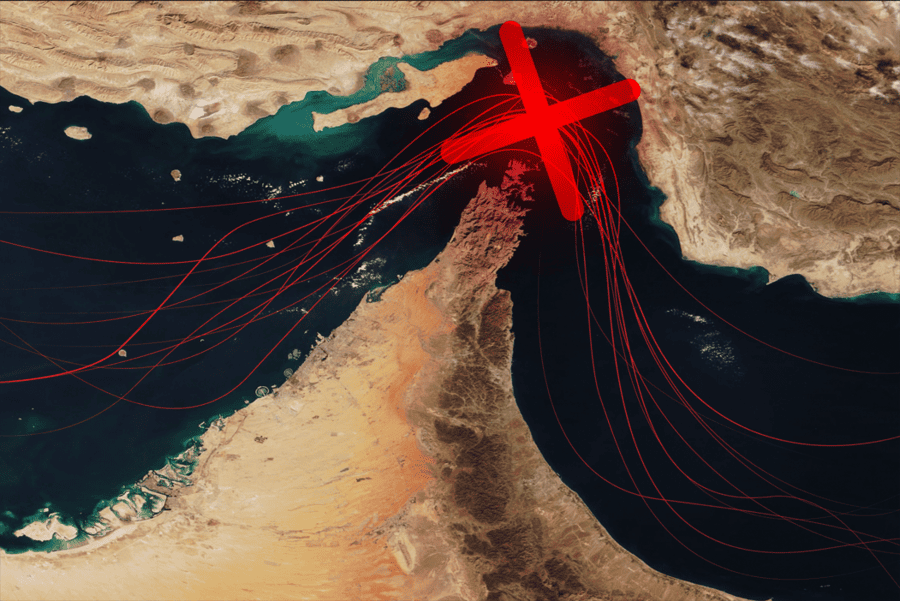
The Iran conflict escalated sharply. The ceasefire that had been negotiated in mid-June collapsed on July 8 when President Trump declared it “over” following fresh attacks on shipping. CENTCOM conducted six consecutive nights of strikes, hitting over 80 targets inside Iran. Iran retaliated by attacking a Kuwaiti power and water desalination plant and launching missiles at US positions in Bahrain, Jordan, Kuwait, Oman, Qatar, and Syria. The Strait of Hormuz was re-closed by Iran’s Revolutionary Guard, and commercial shipping traffic through the waterway has fallen sharply. Iran also instructed Houthi forces to prepare to disrupt Red Sea shipping if the US targets Iranian power infrastructure.
Oil surged roughly 14% on the week. The Nikkei 225 dropped 5.5% on Friday as geopolitical risk weighed on Asian equities. The NASDAQ 100 fell 2.7% on the week while the FTSE 100 was one of the few bright spots, gaining 0.7%.
EUR/USD: The Dollar Flinches
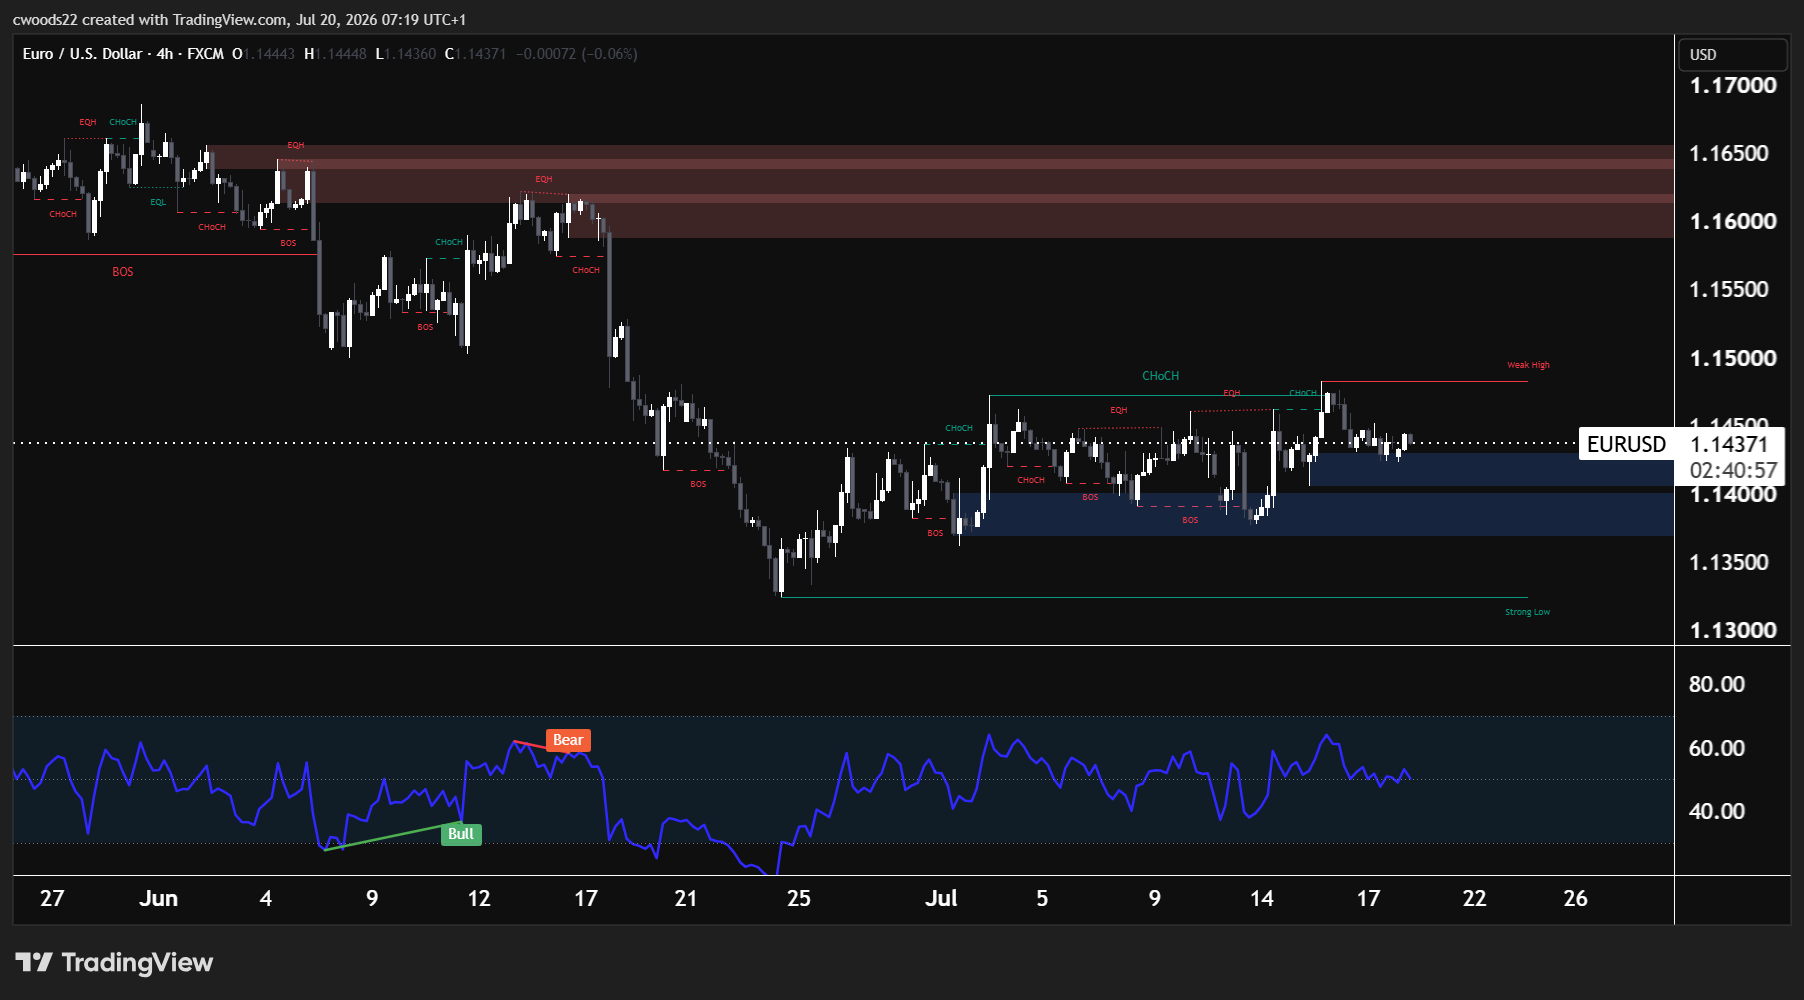
Chart: EUR/USD, H4 timeframe (TradingView, SMC)
The H4 chart shows the full story of EUR/USD’s decline and recovery. From late May through late June, the pair sold off from 1.1700 to 1.1350 through a textbook impulsive move. A bearish change of character at 1.1680 set the tone, followed by a series of break of structure moves through 1.1580, 1.1480, and 1.1420 as the dollar strengthened on Fed hawkishness and risk aversion.
The reversal signals appeared at the right place. A bull RSI divergence formed during mid-June as price pushed to lower lows near 1.1350 while the RSI printed higher lows. This is the classic signal that selling pressure is exhausting even as price continues to fall. The demand zone between 1.1350 and 1.1420 (the blue shaded area) is where buyers finally stepped in, and the recovery has been methodical.
From early July, the pair has printed multiple bullish change of character signals and break of structure confirmations on the way up. The current price at 1.1437 sits in a constructive position: above the demand zone, with the high near 1.1510 as the first structural target. A break above 1.1510 would open a move toward the 1.1580 area, where the previous bearish break of structure originated. On the downside, the low near 1.1300 to 1.1350 is the structural floor that needs to hold for the bullish case to remain intact.
The fundamental picture supports the recovery. Last week’s CPI miss weakened the dollar as traders reduced their expectations for another Fed hike. The ECB’s decision on Thursday is widely expected to be a hold at 2.25% (the deposit rate was raised 25 basis points in June), but the statement and press conference will be closely scrutinised for signals about September. Markets have fully priced in a September hike, and eurozone inflation falling to 2.8% in June from 3.2% in May gives the ECB room to wait. If the ECB sounds dovish and pushes back on September, the euro could give back some of its gains. If the guidance leans hawkish, the pair has room to push toward the 1.1510 high.
The positioning adds a layer of interest. Leveraged funds are net short approximately 53,700 EUR contracts according to the latest COT data, reflecting the bearish sentiment that built up during June’s sell off. Extreme short positioning like this can fuel sharp squeezes if the fundamental picture shifts. With the dollar weakening post CPI and the ECB potentially signalling further tightening, the conditions for a short squeeze are forming.
WTI Crude Oil: The War Premium Returns
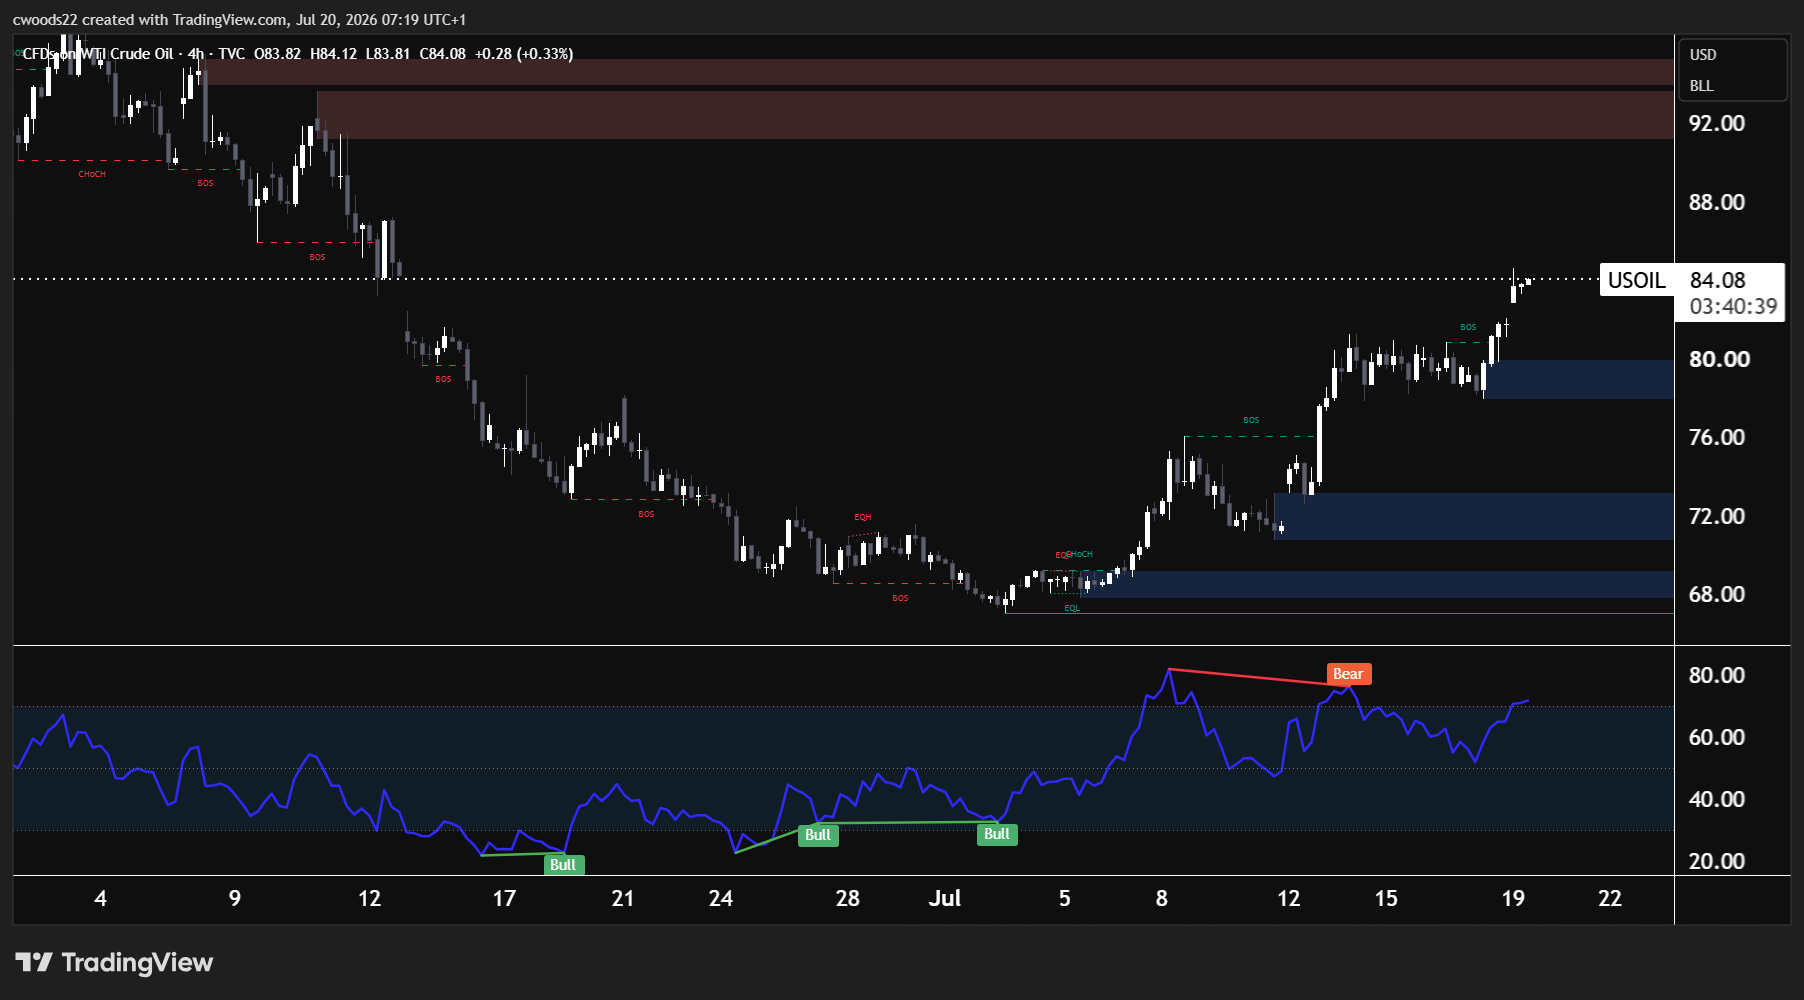
Chart: WTI Crude Oil (USOIL), H4 timeframe (TradingView, SMC)
WTI crude has staged one of the sharpest recoveries of 2026. The H4 chart shows price falling from $92 in early June to the equal lows at $68 (the green line) in early July, a decline of roughly 26%. The sell off was structured: a bearish change of character at $91 was followed by break of structure moves through $87, $80, $74, and $71 as the initial Iran ceasefire removed the war premium and traders began pricing in oversupply.
The reversal at $68 was supported by three bull RSI divergences, the strongest momentum signal on either chart this week. The first appeared around mid-June near $71, the second near $69 in late June, and the third at the equal lows near $68 in early July. Each time, price made a lower low while the RSI made a higher low, building a case that the selling was exhausting long before the fundamental catalyst arrived.
That catalyst came on July 8 when the ceasefire collapsed. The recovery since has been explosive: price has rallied from $68 to $84.08 through a series of bullish change of character and break of structure confirmations at $70, $72, $77, $80, and $81. The demand zone near $79 to $80 (the blue shaded area on the right side of the chart) is the most recent support level, and price has pushed decisively above it.
There is a warning signal. A bear RSI divergence appeared mid-rally in the $77 to $80 area, where price was making higher highs but the RSI printed a lower high. This is a momentum exhaustion signal and suggests that the rally is stretched in the short term. However, the war premium overrides standard technical signals when the world’s most important shipping chokepoint is closed. As long as the Strait of Hormuz remains shut, the geopolitical bid under oil is likely to hold.
The supply zone between $88 and $92 (the red shaded area) is the major resistance and the level where the June sell off began. A push into that zone would require either a further escalation (attacks on Iranian oil infrastructure, for example) or confirmation that Hormuz will remain closed for an extended period. On the downside, if diplomatic efforts resume and the Strait reopens, a pullback to the $79 to $80 demand area is the first level to watch. A deeper correction to the $72 to $73 demand would require a full de-escalation.
Key Events This Week
Wednesday 22 July UK CPI (June)
Forecast at 3.6% year on year, up significantly from 2.8% in May. The jump is expected to be driven by the energy price cap increase and base effects. A hot print would reinforce expectations for a Bank of England rate hike and support GBP crosses. The next BOE decision is July 30.
Thursday 23 July ECB Interest Rate Decision
Markets price an 88% probability of a hold at 2.25% (deposit rate). The decision itself is unlikely to surprise. The focus will be on President Lagarde’s press conference and any guidance about whether September is a live meeting for a rate hike. Eurozone inflation fell to 2.8% in June, giving the ECB room to pause.
Friday 24 July Flash PMIs (Germany, Eurozone, UK, US)
S&P Global preliminary PMIs for July. Eurozone services were still in contraction at 48.9 in June, while manufacturing was stable at 51.4. US services were at 51.3. These numbers will shape expectations for Q3 growth across all major economies and influence central bank rhetoric heading into August.
View our economic calendar here for the full schedule of events this week.
Risk Warning: Trading financial instruments, particularly those involving leverage, involves a substantial degree of risk and is not appropriate for all investors. The value of your investments can rise or fall sharply, and it is possible to lose the entirety of your invested capital. Do not trade with funds you cannot afford to lose. Nothing in this site should be read or construed as constituting advice on the part of Taurex or any of its affiliates, directors, officers or employees.