
U.S. equity markets experienced sharp volatility and notable fluctuations during yesterday’s session amid the ongoing war between the United States and Israel against Iran. In this context, major U.S. indices closed mixed, with the S&P 500 rising 0.04%, the Nasdaq 100 gaining 0.13%, and the Russell 2000 advancing 1.00%, while the Dow Jones Industrial Average declined by 0.15%.
U.S. equity markets are currently facing several key risks:
First, inflationary risks: Minutes from the Federal Reserve, released two weeks ago, revealed that some policymakers may consider raising interest rates if inflation remains elevated. The minutes also indicated that the vast majority of members continue to see persistent inflation risks, while risks related to the labor market have eased. Core Personal Consumption Expenditures (PCE) rose 3.0% year-over-year, exceeding expectations of 2.9% and the previous reading of 2.8%. Meanwhile, Core Producer Price Index (PPI) increased by 3.6% year-over-year, above both expectations of 3.0% and the prior reading of 3.3%, with both indicators remaining well above the Federal Reserve’s 2% target. In addition, the sharp rise in crude oil prices due to the ongoing conflict and the closure of the Strait of Hormuz — a vital artery for global energy markets through which nearly 20% of global oil demand and more than a quarter of seaborne oil trade pass — could significantly fuel inflationary pressures.
Second, geopolitical tensions, particularly the ongoing war involving the United States and Israel against Iran, have intensified fears of a broader conflict. Uncertainty surrounding the duration and outcome of the war is increasing pressure on risk assets, especially equities.
Third, risks related to technology stocks, particularly those tied to artificial intelligence, amid renewed concerns about whether massive investments in this sector can generate returns exceeding the cost of debt.
The VIX volatility index rose 8% yesterday to 25.24 points — its highest level since November 25, 2025 — before closing at 21.43 points, reflecting heightened market anxiety.
In this context, three key developments stand out:
The Dow Jones Industrial Average has outperformed since the beginning of the year, rising 1.62%, compared to a 0.53% gain in the S&P 500 and a 1% decline in the Nasdaq 100, signaling a relative outperformance of value stocks over growth stocks at this stage.
The Russell 2000 index, which tracks small- and mid-cap stocks, has outperformed other U.S. indices by approximately 7%, reflecting portfolio rotation amid an environment of U.S. rate cuts.
The equal-weighted S&P 500 has outperformed the benchmark index by around 7%, indicating broader market participation and solid internal strength.
Furthermore, sector analysis of the S&P 500 shows that eight sectors have posted gains, while three sectors have declined. The energy sector led gains, rising approximately 28%, followed by industrials at 15%, utilities at 11%, and materials at 17%.
Momentum also remains positive in semiconductor stocks, with the Philadelphia Semiconductor Index rising about 15% year-to-date.
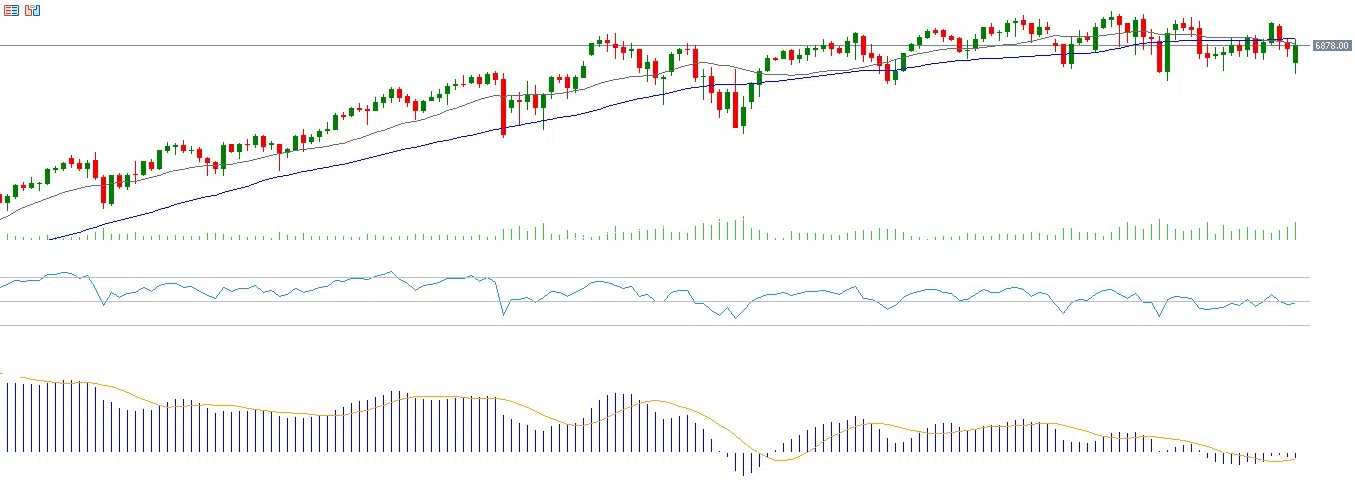
From a technical perspective, the S&P 500 recently recorded a bearish crossover between the 20-day moving average and the 50-day moving average, which may signal the beginning of a downward trend. The Relative Strength Index (RSI) stands at 48, indicating weakening momentum, while a bearish crossover between the MACD line and the signal line further reinforces the likelihood of continued negative momentum.
Please note that this analysis is provided for informational purposes only and should not be considered as investment advice. All trading involves risk.


