By Connor Woods, Global Head of Trading Education | 3 July 2026
Key Points
- Every AI data centre built in 2026 requires between 27 and 47 tonnes of copper per megawatt of capacity, and US data centre capacity is growing 25% in a single year. JPMorgan estimates AI alone will add 110,000 tonnes of copper demand this year. Everyone knows NVIDIA powers AI. Almost nobody is watching the metal that wires it all together.
- The supply side is in crisis. Chile’s output fell 9% year on year in March, treatment charges have gone negative (smelters are now paying miners for concentrate), and the deficit is projected between 150,000 and 600,000 tonnes depending on the source. Section 232 tariffs of 50% on semi finished copper imports are adding another layer of distortion.
- The daily chart shows copper at 62,581 sitting between BOS support at 60,000 and the supply zone at 64,000 to 66,000. Four bear RSI divergences since October 2025 warn that momentum is fading on each push higher, but the fundamental case is so strong that every pullback has been bought. The high at 66,000 to 68,000 is the level that needs to break for the next leg up.
Why Copper? Why Now?
Everyone is watching NVIDIA, Microsoft, and the NASDAQ 100 for the AI trade. But there is a quieter version of the same trade sitting in the commodities market, and it has a supply problem that chipmakers do not.
A single AI data centre requires between 27 and 47 tonnes of copper per megawatt of installed capacity. That covers the power distribution systems, the busbars, the cabling, the cooling infrastructure, and the transformers. When you include the upstream grid reinforcements (high voltage transmission lines, substations, redundant power feeds), the figure rises to 100 to 150 tonnes per megawatt. US data centre capacity is projected to grow from 44 gigawatts in 2025 to 55 gigawatts in 2026, a 25% increase in twelve months. JPMorgan estimates that AI data centres alone will contribute 110,000 tonnes of additional copper demand this year compared to pre AI baselines.
And AI is only one piece. Electric vehicles use up to four times more copper than a traditional car. Grid modernisation for renewable energy requires enormous quantities of copper wiring. China’s 15th Five Year Plan places heavy emphasis on clean energy, digital infrastructure, and EV expansion. Goldman Sachs cites EVs, renewables, defence spending, and AI as the structural demand drivers that make copper the most strategic industrial metal of the decade.
The Supply Crisis Nobody Is Watching
If the demand story is compelling, the supply story is alarming.
Chile, the world’s largest copper producer, saw national output fall 9% year on year in March 2026. Codelco (the state owned miner) was down 10%, BHP’s Escondida (the world’s largest copper mine) fell 15.75%, and Collahuasi dropped 10.8%. Peru’s major mines (Las Bambas, Constancia) are facing disruptions and slow permitting. The pipeline of new mines is weak, and the projects that do exist are years from production.
The smelting side is even more strained. Treatment charges, which is the fee smelters charge miners to process copper concentrate, have gone negative. At negative $66.40 per tonne in Q1 2026, smelters are effectively paying miners for the right to process their concentrate. That is unprecedented and signals that the physical copper market is tighter than the futures price suggests. China’s decision to halt sulfuric acid exports in May 2026 has compounded the problem, since 15% of global copper production depends on sulfuric acid availability.
The deficit estimates vary but the direction is unanimous. The International Copper Study Group projects a 150,000 tonne shortfall. JPMorgan forecasts 330,000 tonnes. Morgan Stanley expects 600,000 tonnes, which would be the largest refined copper deficit in over 20 years.
On top of all of this, the US imposed Section 232 tariffs of 50% on semi finished copper products (pipes, wires, rods, sheets) effective August 2025, with modifications in April 2026 adding 25% on copper intensive derivative products. This has distorted trade flows, pushed US domestic premiums higher, and created a two tier pricing structure that adds complexity for anyone trading the metal globally.
The Chart: Where Is Copper Headed?
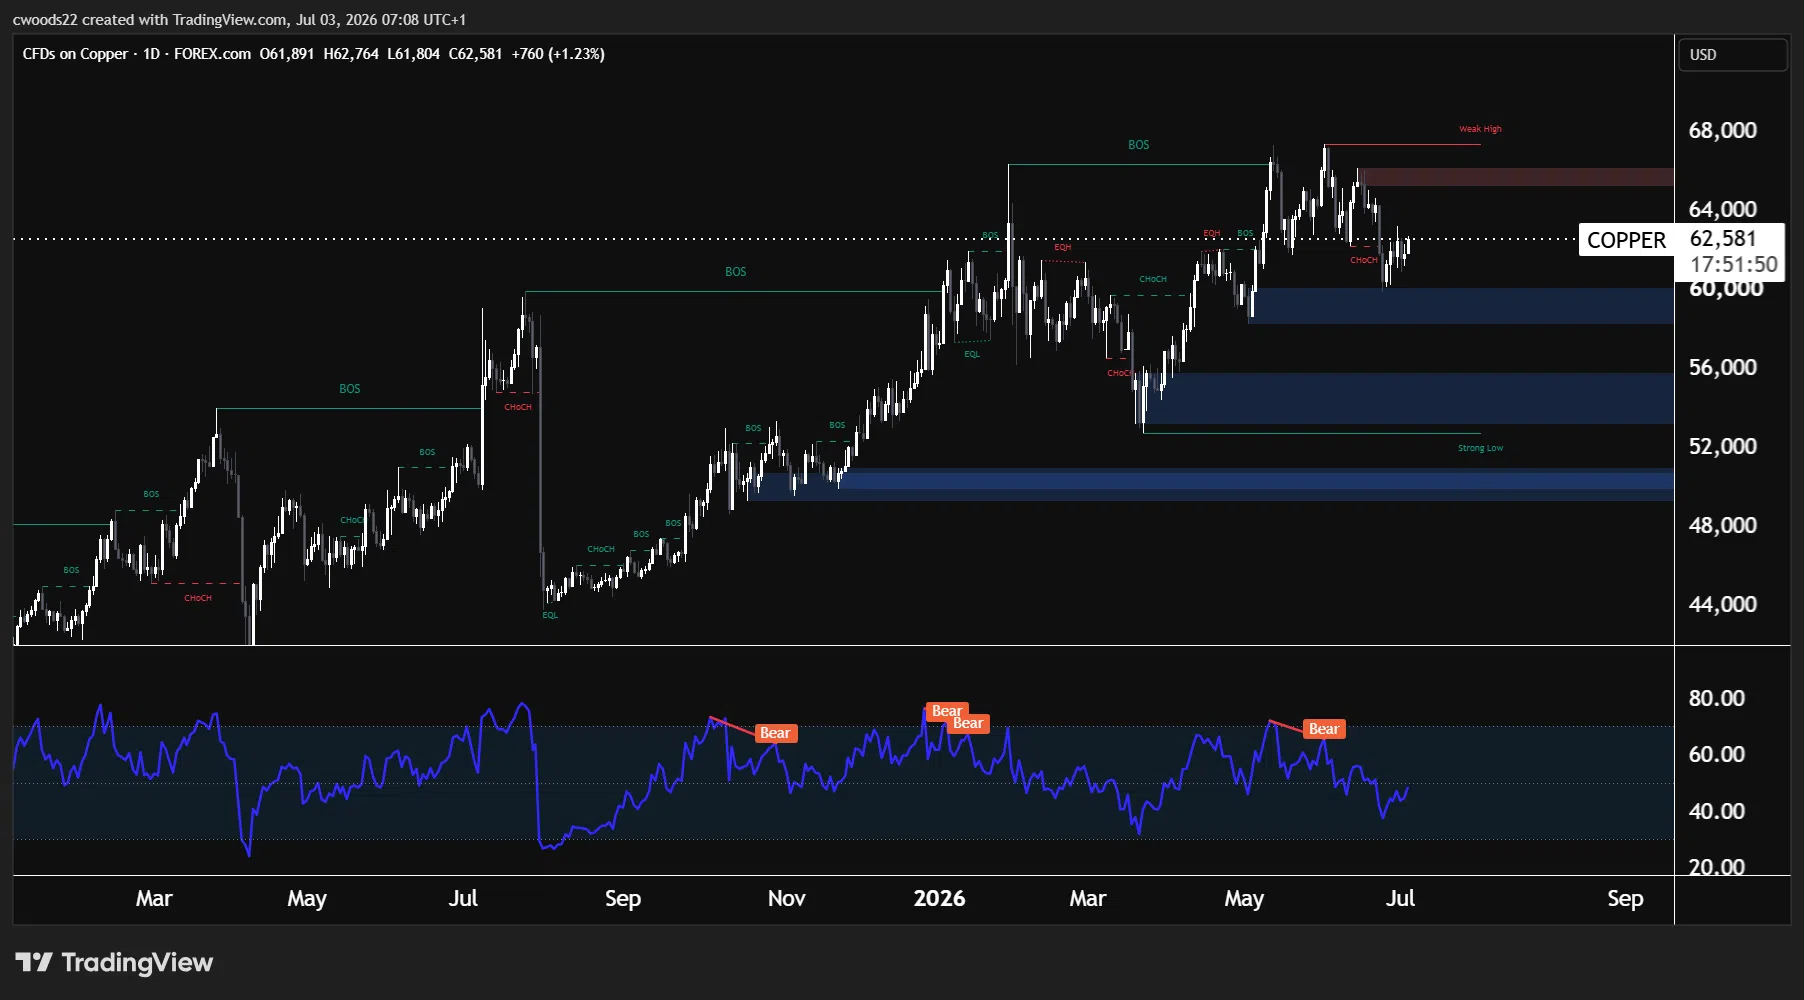
Chart: Copper CFD, Daily timeframe (TradingView, SMC)
The daily chart shows copper at 62,581, sitting in the middle of the range that has defined trading since January 2026. The broader picture is bullish: price has rallied from approximately 42,000 in early 2025 to peaks near 68,000, with multiple Break of Structure (BOS) confirmations on the way up and a clear structural floor at the BOS level around 60,000 (the green horizontal line on the chart).
The supply zone between 64,000 and 66,000 (the red shaded area) has capped every push higher since January. Above it sits the Weak High at 66,000 to 68,000, which represents the ceiling for this entire move. A clean break above 68,000 would confirm the next bullish leg and likely trigger a move toward 72,000 to 75,000. Given the deficit projections and AI demand trajectory, this breakout scenario has strong fundamental backing.
However, the RSI tells a different story. Four bear divergences have appeared since October 2025: price has been making higher highs, but RSI has been making lower highs each time. Every push toward the supply zone arrives with less momentum than the last. So far, every divergence has been resolved by a pullback that gets bought at support rather than a full reversal, but the pattern is persistent and VIP readers should be aware that the next test of 64,000 to 66,000 comes with the weakest momentum yet.
Positioning adds context. Speculators hold a net long position of 71,600 contracts, down from 75,400 the previous week. The gradual reduction in longs aligns with the RSI divergence: the bulls are still in control, but conviction is waning at these levels. A shakeout toward the 60,000 BOS level or even the Strong Low at 52,000 to 53,000 (where the blue demand zones sit) would reset positioning and give the fundamental story room to drive the next leg.
The scenarios for July are clear. If copper holds 60,000 and the FOMC on July 29 does not deliver a rate hike, the path toward 66,000 to 68,000 reopens. If the dollar surges on a hawkish Fed, expect a test of 58,000 to 60,000 before buyers step in. And if China announces further stimulus for its energy transition (which the 15th Five Year Plan suggests is coming), copper could be the biggest beneficiary in the commodities complex.
What Could Go Wrong
The bear case centres on three risks. First, the dollar. Copper is priced in dollars, and the DXY above 100 creates a headwind for all commodities. A Fed rate hike would strengthen the dollar further and pressure copper in the short term, regardless of the supply deficit. Second, China. The property sector remains weak and China’s 10 year yield at 0.3% signals deflationary pressures. If China’s energy transition spending slows, the largest source of copper demand in the world weakens. Third, the Section 232 tariffs are distorting trade flows in ways that are difficult to model. A 50% tariff on semi finished copper creates incentives for stockpiling and diversion that can disconnect the futures price from physical market tightness.
None of these risks invalidate the structural bull case. They explain why copper has not yet broken through 68,000 despite a supply deficit that would normally send prices significantly higher. The divergence between fundamentals and price action is exactly what makes this market worth watching closely.
Risk Warning: Trading financial instruments, particularly those involving leverage, involves a substantial degree of risk and is not appropriate for all investors. The value of your investments can rise or fall sharply, and it is possible to lose the entirety of your invested capital. Do not trade with funds you cannot afford to lose. Nothing in this site should be read or construed as constituting advice on the part of Taurex or any of its affiliates, directors, officers or employees.