
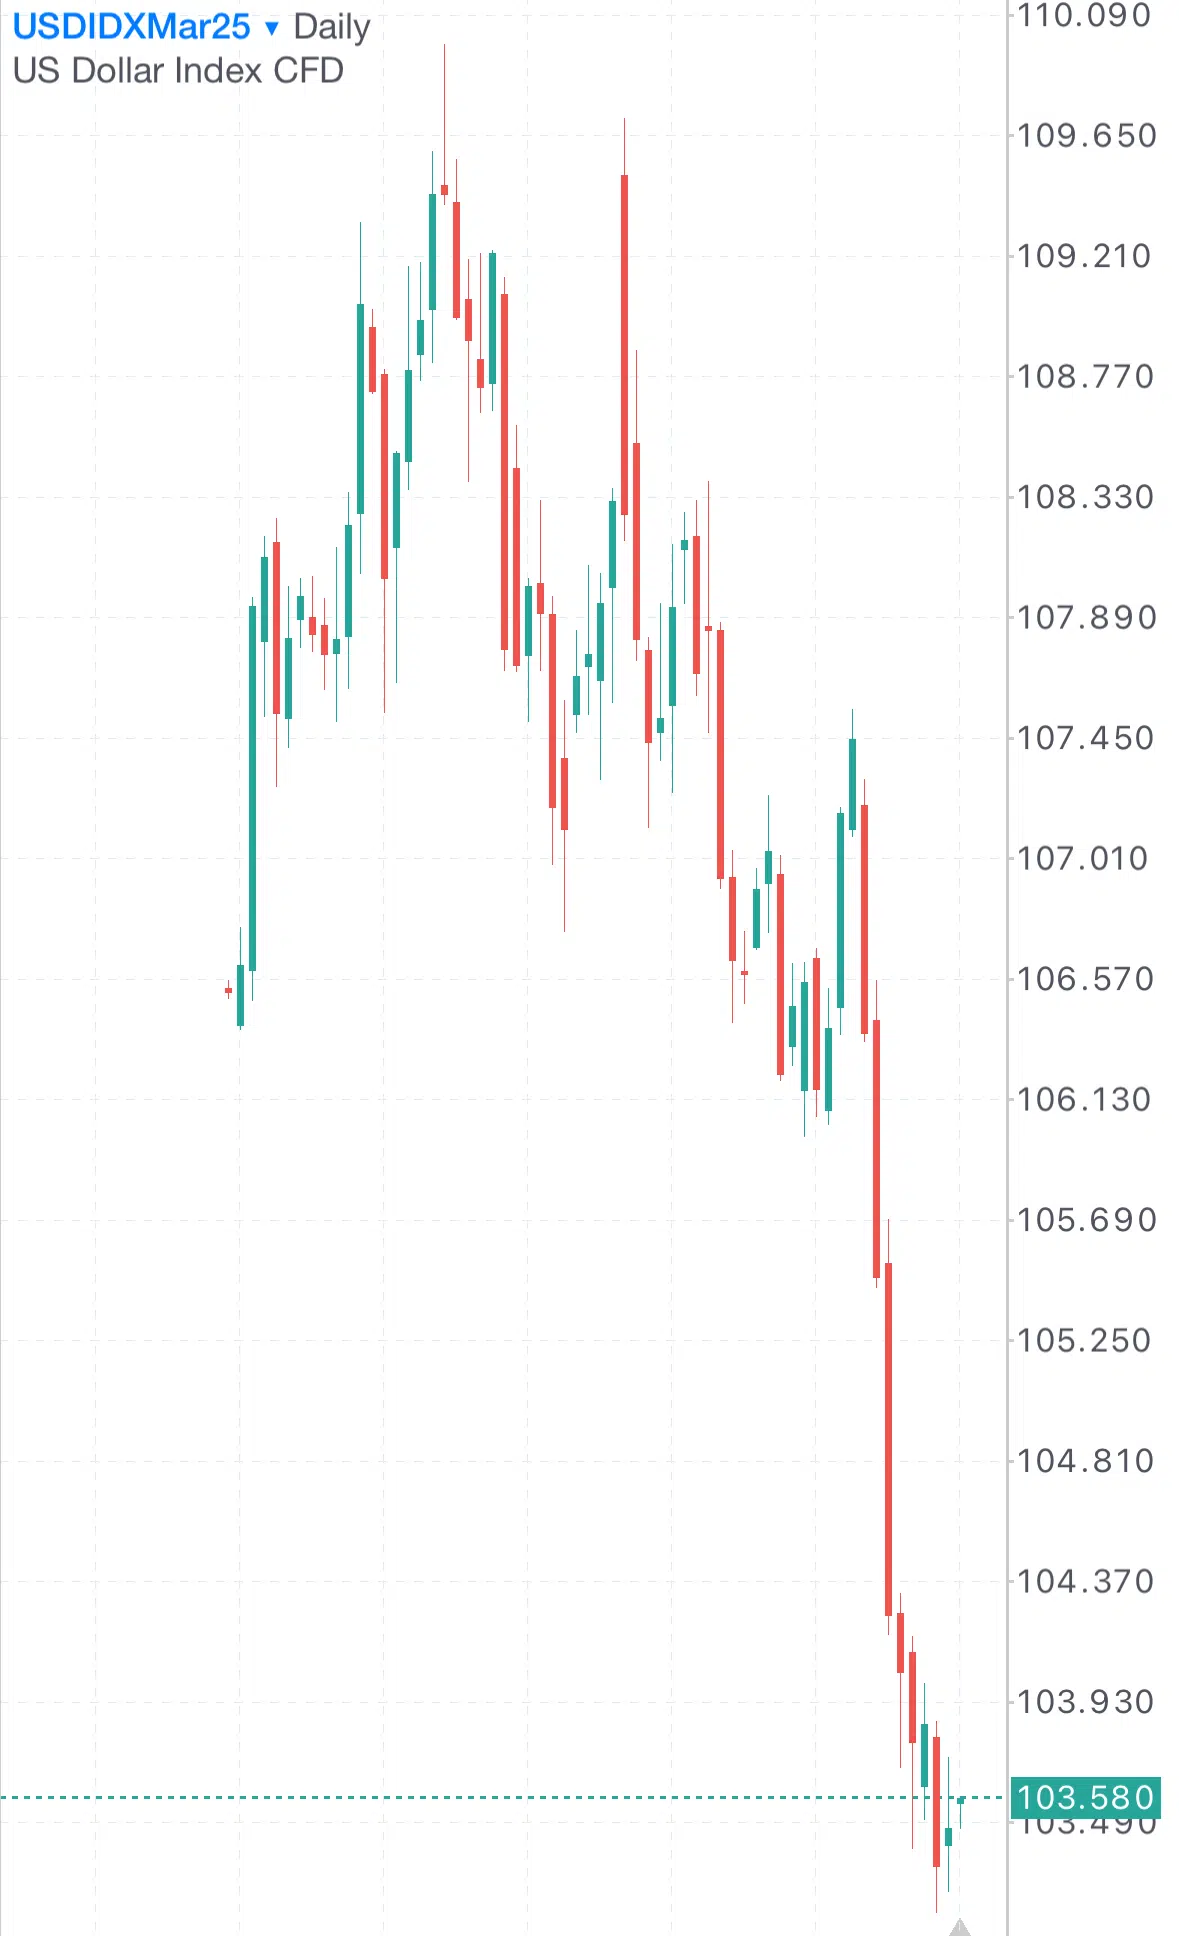
After reaching its highest level this year on January 13, 2025, at 110.17 points, the U.S. Dollar Index (DXY), which measures the dollar’s performance against a basket of six major currencies, has declined to 103.22 points two days ago, marking its lowest level since October 16, 2024. This represents a drop of approximately 6%. Currently, the index is trading around 103.60 points and has fallen by about 4% since the beginning of the year.
Reasons Behind the Decline in the U.S. Dollar Index:
- Falling U.S. Treasury Yields: The yield on the 2-year Treasury bond, which is highly sensitive to Federal Reserve policy, dropped to 3.829% two days ago, its lowest level since October 4, 2024. Meanwhile, the yield on the 10-year Treasury bond, which is more affected by U.S. fiscal policy, fell to 4.108%, its lowest level since October 21, 2024.
- Weak U.S. Economic Indicators: The latest data shows a slowdown in the U.S. economy, including a weaker-than-expected non-farm payroll report, which recorded 151,000 new jobs—below expectations of 159,000. Additionally, the unemployment rate rose to 4.1%, exceeding both expectations and the previous reading of 4.0%. Furthermore, both the headline and core Consumer Price Index (CPI), which excludes food and energy, recorded 2.8% and 3.1%, respectively—both below expectations and the previous readings, increasing the likelihood that the Federal Reserve will cut interest rates in the near future.
- Uncertainty Surrounding Tariffs Between the Trump Administration and Several Countries.
- Fears of a U.S. Economic Recession.
Technical Analysis:
Technical indicators suggest further downward pressure on the U.S. Dollar Index in the coming period due to the following factors:
- Bearish Moving Averages Alignment: The 200-day moving average is above the 50-day moving average, and the 50-day moving average is above the 20-day moving average, indicating a downward trend.
- Relative Strength Index (RSI): Currently at around 27 points, signaling oversold conditions and reflecting the bearish momentum of the dollar.
- Directional Movement Index (DMI): The positive directional index (DMI+) is at approximately 12 points, while the negative directional index (DMI-) is at around 39 points, showing a significant gap between the two, indicating strong selling pressure on the dollar.
Please note that this analysis is provided for informational purposes only and should not be considered as investment advice. All trading involves risk.


