
Most traders use 1-minute or 5-minute charts without thinking about whether those candles truly show what is happening in the market. During slow trading sessions, a time-based candle can form from only a few price updates, which can make the market look more active than it really is.
Forex Tick Charts work differently because they build each bar based on actual market activity instead of time.
In this guide, you will learn what tick charts are, how to read them, how they compare to time-based charts, the best settings for different trading styles, and four practical tick chart trading strategies you can apply immediately.
What Are Tick Charts in Forex?
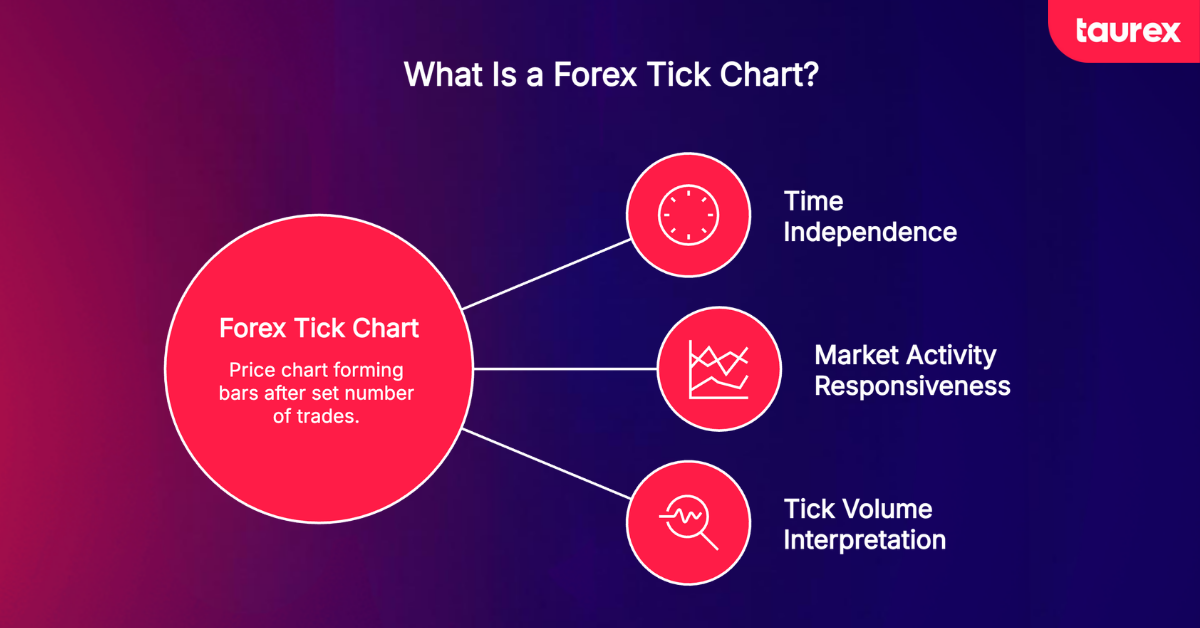
A forex tick chart is a price chart that generates a new bar only after a predetermined number of trades or price changes have occurred, regardless of how much time passes.
For example, a 144-tick chart forms a new candle after every 144 market movements. During active sessions, candles appear in rapid succession. During quieter periods, the chart slows down and fewer bars form.
This is the defining difference in tick chart trading: a standard 5-minute chart prints a candle every 300 seconds, whether one trade or one thousand trades took place. A tick chart only creates a new bar when there is enough real market activity to justify it.
Because Forex is a decentralised, over-the-counter market, tick volume in Forex trading does not measure actual traded contracts. Instead, it counts how frequently price changes within each bar, giving traders a practical estimate of market participation and interest.
How to Read Tick Charts in Forex
Each tick bar includes the same four parts as a normal candlestick: Open, High, Low, and Close. The Open is the first price in the sequence, the High is the highest price reached, the Low is the lowest price, and the Close is the final price before a new bar begins.
Most tools used on regular charts also work on tick charts. This includes support and resistance, trendlines, moving averages, RSI, and MACD. The main difference is how the chart moves. When tick bars form very quickly, it usually means market activity and momentum are strong. When bars take longer to form, the market is moving more slowly.
On MetaTrader 4, the tick volume indicator also shows market activity by counting price changes.
Forex Tick Charts vs Time-Based Charts
Understanding what tick charts are relative to familiar time-based charts is the fastest way to decide whether they suit your trading style.
Tick Charts vs 1-Minute Charts
A 1-minute chart creates a new candle every minute, even when market activity is very low. This can lead to small and less meaningful candles during quiet sessions. Tick charts avoid this problem because a new bar only forms after a set amount of market activity.
During volatile periods, a single 1-minute candle can contain many price movements. A tick chart spreads those movements across multiple bars, making price action easier to read. Many traders use 1-minute charts for a broader market view and tick charts for more precise entries.
Tick Charts vs Candlestick Charts
Many traders confuse these two terms. Candlesticks are simply a way to display price data. Both tick charts and time-based charts can use candlestick visuals.
The real difference is what creates a new candle. Time-based charts form candles after a fixed amount of time, while tick charts create candles after a set number of trades or price changes.
| Feature | Tick Chart | Time-Based Chart |
| Bar trigger | Fixed trade count | Fixed time interval |
| Activity-sensitive | Yes | No |
| Best use case | Scalping, precision entries | Swing trading, trend analysis |
| Noise during slow markets | Low | Higher |
| Learning curve | Moderate to High | Lower |
Why Do Professional Forex Traders Use Tick Charts?
Professional scalpers, day traders, and order flow traders often use tick charts because they focus on real market activity instead of fixed time periods. During quiet sessions, fewer bars form, which helps traders avoid weak signals that appear on time-based charts even when the market is barely moving.
Tick charts can also help traders spot momentum changes earlier. When bars begin forming much faster than usual, it can signal stronger market participation and the start of a breakout or trend continuation. EUR/USD activity often increases during the London and New York session overlap, which is one of the busiest periods in Forex trading.
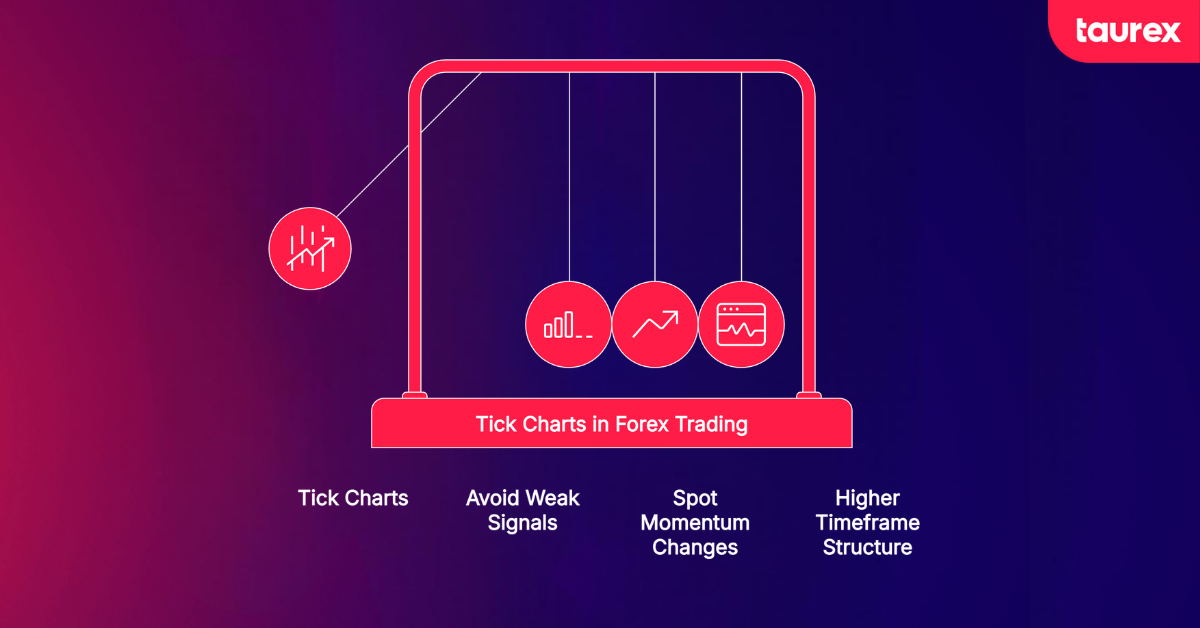
Traders who specialise in Forex technical analysis often pair tick charts with higher-timeframe structure for this reason: the tick chart shows the heartbeat, while the H1 or H4 chart shows the broader pulse.
Advantages and Limitations of Forex Tick Charts
Forex tick charts can give traders a clearer view of market activity, especially during fast-moving sessions. They are popular with scalpers and short-term traders because they focus on real trading activity instead of fixed time intervals.
Benefits of Tick Charts for Active Traders
- Tick charts reduce market noise because bars only form when enough trading activity happens.
- Each candle represents a similar level of market participation, which makes price action look more consistent.
- They react quickly to sudden increases in activity, making them useful for scalping and momentum trading.
- Fast bar formation can signal growing momentum, while slower bar formation may show that momentum is fading.
- Tick charts often provide more precise entry and exit signals during active trading periods.
Limitations of Tick Volume in Forex Markets
Forex tick volume is only an estimate of activity because the Forex market has no centralised exchange. According to the Bank for International Settlements, OTC FX trading reached $9.6 trillion per day in April 2025, up 28% from 2022.
This market activity is spread across banks, dealers, brokers, and trading venues rather than one central exchange, which is why retail Forex platforms rely on tick volume as a practical estimate of activity:
- Historical tick data is often limited, which can make backtesting more difficult.
- Different brokers may show slightly different tick charts because their data feeds vary.
- Tick charts can move very quickly during news events, which may lead to emotional or impulsive trades.
- Many traders use tick charts together with time-based charts instead of relying on them alone.
Common Mistakes Traders Make With Tick Charts
Tick charts can improve trade timing, but they can also lead to mistakes when traders focus too much on short-term movement. Understanding the bigger market picture is still important, even when using fast-moving charts.
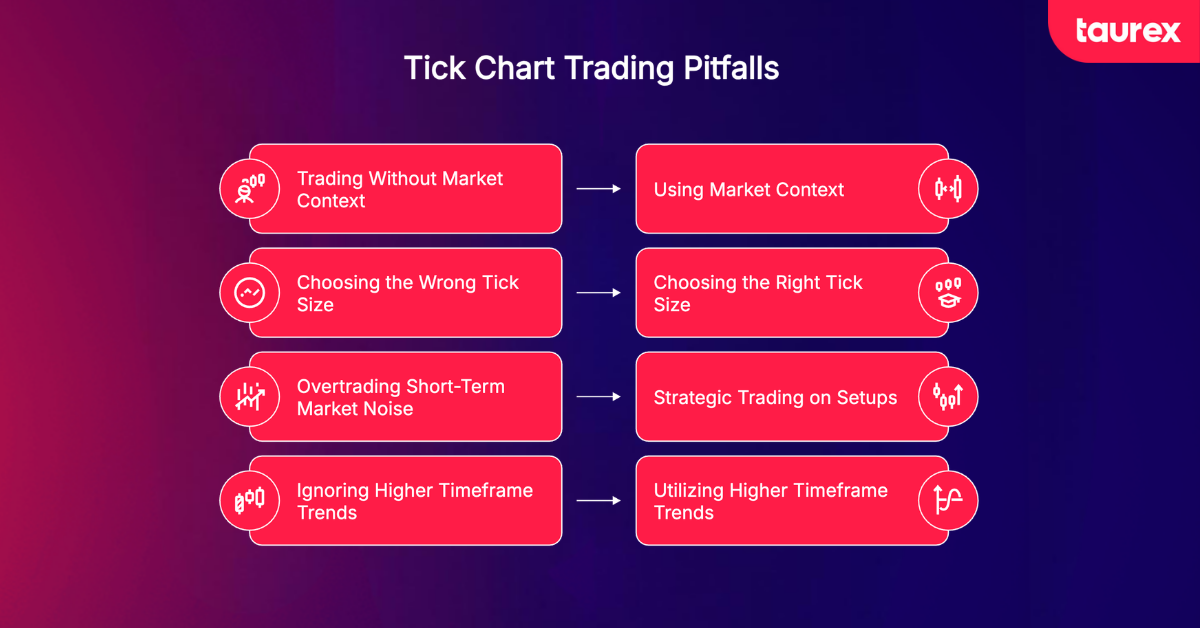
Using Tick Charts Without Market Context
Many traders make the mistake of trading only from a tick chart without checking the overall market trend. A setup on a small tick chart is less reliable if it goes against the direction shown on higher timeframes like H1 or H4. Always confirm signals with the broader market structure.
Choosing the Wrong Tick Size
Using a very small tick setting during volatile sessions can create too much noise and too many false signals. On the other hand, very large tick settings during quiet sessions can make charts move too slowly. The best tick size depends on the currency pair and current market conditions.
Overtrading Short-Term Market Noise
Tick charts move quickly, so small price changes can easily look like trading opportunities. Some traders enter too many positions during the same move instead of waiting for one strong setup. It is usually better to wait for confirmation, such as strong volume or a clean candle close, before entering a trade.
Ignoring Higher Timeframe Trends
Support and resistance levels from larger timeframes still matter when trading on tick charts. Many traders use tick charts for entries while relying on higher timeframe charts for overall analysis and direction.
Best Tick Chart Settings for Forex Trading
There is no single “best” tick chart setting because it depends on the market, your strategy, and volatility. Most traders adjust their settings based on trading style and session conditions.
Common Tick Sizes Used by Forex Traders
Fibonacci intervals are commonly used by professional tick chart traders because they align with natural market rhythm and are also widely known from tools like Fibonacci retracements in technical analysis. Common choices include 89, 144, 233, and 610 ticks. Some traders also prefer simpler numbers like 100, 200, or 500, especially in other markets such as futures. The right setting depends on your trading approach and the currency pair you are analyzing.
Tick Settings for Scalping
Scalpers usually work with lower tick settings, typically between 70 and 144 ticks. These settings help capture small, fast price movements in real time. During very active sessions, bars can form within seconds, so quick decision-making is important. A useful rule is that if 100-tick bars form too quickly, it may be better to increase the setting to reduce noise.
Tick Settings for Intraday Trading
For intraday trading, mid-range settings like 233 to 610 ticks are more common. A 233-tick chart often acts as a balanced option, offering enough detail without too much noise. Many traders use a 233-tick chart for entries and a 610-tick chart to understand the broader trend.
How to Choose the Right Tick Chart Based on Volatility
It helps to adjust your tick settings based on Forex volatility and overall market conditions:
- High volatility or news events: use larger settings like 233 to 500+ to filter out erratic moves.
- Low volatility or quiet sessions: use smaller settings like 70 to 144 to capture more detail.
- By currency pair: major Forex pairs like EUR/USD can handle higher tick settings, while less liquid pairs often work better with smaller ones.
Markets change throughout the day, so many traders adjust their tick settings between Forex market sessions like the London open, New York overlap, and late US trading hours. You can explore different tick settings in a risk-free demo environment with Taurex before applying them in live market conditions.
4 Tick Chart Trading Strategies for Forex Traders
Here are four practical tick chart strategies that work well across major Forex pairs and active trading sessions. Each approach focuses on timing entries more precisely using real market activity.
1. Tick Chart Scalping Strategy
- Best pairs: EUR/USD and GBP/USD, where liquidity is deepest.
- Best session: London to New York overlap (around 1 PM to 4 PM GMT)
- Tick setting: 70 to 144 ticks
Enter trades in the direction of the short-term trend using strong momentum candles. Place tight stops just beyond the previous swing and exit quickly when momentum starts to slow down. A key confirmation is faster bar formation combined with rising tick volume.
It is also important to avoid late-session trading when liquidity drops, and spreads can widen.
2. Breakout Trading With Tick Charts
Look for consolidation zones where tick bars form slowly, showing low market interest. Wait for a clear candle close outside the range before entering.
Confirm the breakout with:
- Increasing tick volume
- Faster bar formation
- Alignment with indicators like RSI or MACD
Avoid entering on wicks alone. Always wait for a full candle close beyond the level. Stops are usually placed just beyond the breakout candle’s high or low.
This approach pairs well with order block trading concepts, where institutional zones often coincide with consolidation areas before a breakout.
3. Trend Following on Tick Charts
Start with a higher timeframe like H1 or H4 to identify the main trend. Then switch to a 233-tick or 610-tick chart for entries.
Use a 20 EMA on the tick chart to track short-term direction. Enter trades when the price pulls back to the EMA and continues in the trend direction.
Exit when bar formation slows, or tick volume weakens, which often signals that momentum is fading.
4. Combining Tick Charts With Volume and Price Action
Even though Forex tick volume is not real exchange volume, it still helps measure market activity.
- Rising tick volume during an up move can confirm trend strength
- Price making new highs while volume drops can signal weakening momentum
- Volume shifts on up-ticks or down-ticks can hint at accumulation or distribution
For better accuracy, combine these signals with price action patterns like pin bars or engulfing candles.
Final Thoughts
Tick charts can be a powerful tool for active Forex traders, but they are best seen as a precision tool rather than a full trading system. They work especially well during high-activity sessions, on liquid currency pairs, and when combined with higher timeframe analysis.
It is a good idea to start with a demo account before using tick chart strategies in live trading. Testing different Fibonacci-style settings can also help you find what fits your trading style best.
The key skill is knowing when to adjust your settings, when to stay out of the market, and when to take action. Traders who master this balance tend to use tick charts more effectively than those who react to every small price movement.
At Taurex, we believe that every chart you study helps you build more control and confidence in your trading decisions.
Ready to put this into practice? Open a demo account and test tick chart trading in real market conditions without risks.
FAQ
What is a Forex tick chart?
A Forex tick chart is a price chart that creates a new bar based on a fixed number of completed trades instead of time. For example, a 144-tick chart forms a new candle after every 144 transactions. This makes the chart reflect real market activity rather than the clock.
How do tick charts work in Forex trading?
Tick charts count each trade as one tick. Once the set number of ticks is reached, a new bar forms showing the open, high, low, and close for that sequence. The chart speeds up when the market is active and slows down during quiet periods.
Are tick charts better than time charts?
Not necessarily. It depends on your trading style. Tick charts are better for scalpers and active traders who need precise entries. Time-based charts are better for swing traders and beginners who focus on broader trends and session structure.
What is the best tick chart setting for Forex?
There is no single best setting. Common choices include 70, 144, and 233 ticks for scalping, while 233 to 610 ticks is often used for intraday trading. The right setting depends on volatility, liquidity, and the currency pair you are trading.
Do professional Forex traders use tick charts?
Yes. Many scalpers, day traders, and order flow traders use tick charts to better understand momentum and market activity. They are especially useful during high-volume sessions like the London to New York overlap.
Are tick charts good for scalping?
Yes, tick charts are widely used for scalping. They filter out low-activity noise, respond quickly to market changes, and help traders time entries more precisely. Lower settings, like 70 to 144 ticks, work well on liquid pairs such as EUR/USD during active sessions.
What is the difference between tick charts and candlestick charts?
Candlestick charts are just a visual format and can be used on both tick and time-based charts. The real difference is what creates a new candle. Time charts use fixed intervals, while tick charts use a set number of trades or price movements.
What’s the difference between Forex tick charts and time-based charts?
Time-based charts form new candles at fixed time intervals, regardless of activity. Tick charts only form new candles when a specific number of trades have occurred, making them more responsive to real market activity.
Can beginners use Forex tick charts?
Yes, beginners can use tick charts, but it is better to start with higher settings like 233 or 500 to reduce noise. It is also recommended to practise on a demo account first, since tick charts move faster and require quicker decisions.

