
Last week featured several important economic data releases on a global scale. In the United States, inflationary pressures showed signs of easing, with both the Consumer Price Index (CPI) and Producer Price Index (PPI) declining. Meanwhile, labor market data remained resilient, although retail sales posted limited growth. The University of Michigan Consumer Sentiment Index fell to 50.8, reflecting weaker sentiment among American consumers.
In the Eurozone, GDP data came in below expectations, while industrial production surprised to the upside. In the UK, recent data showed an improvement in GDP and retail sales, although industrial production declined and unemployment rose. In Australia, employment data surprised markets with strong job gains. New Zealand showed an improvement in industrial activity, while Japan’s economy unexpectedly contracted on a quarterly basis. In China, a sharp slowdown in new lending indicated weakening credit demand.
Market Analysis
GBP/USD
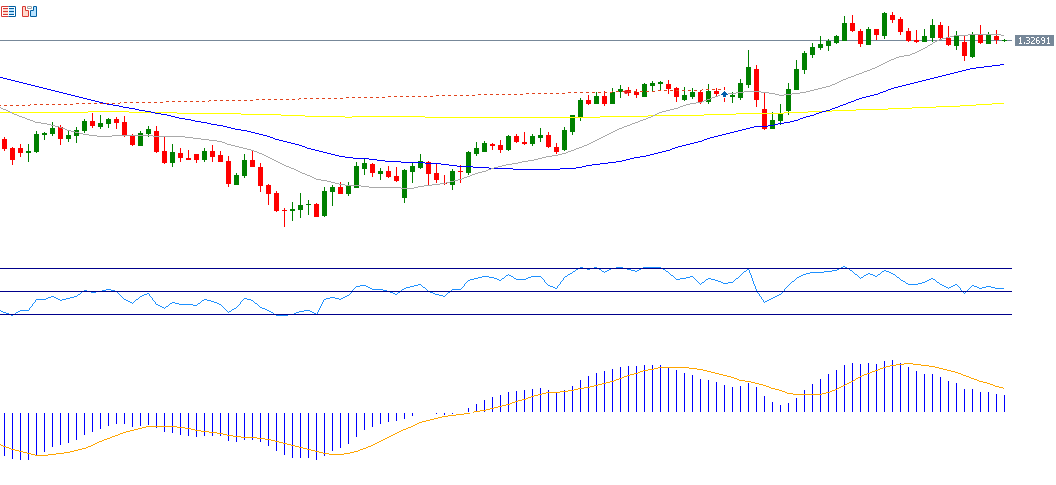
The GBP/USD pair reached a high of 1.3444 on April 28, 2025—its highest level since February 24, 2022. It has risen by nearly 11% from the January 13, 2025 low of 1.2100 to its recent peak. The pair is currently trading near the 1.3300 level and is up around 6% year-to-date.
Recent UK economic data suggest resilience in the British economy. The Relative Strength Index (RSI) is currently at around 53, indicating continued positive momentum for the GBP/USD pair.
Home Depot
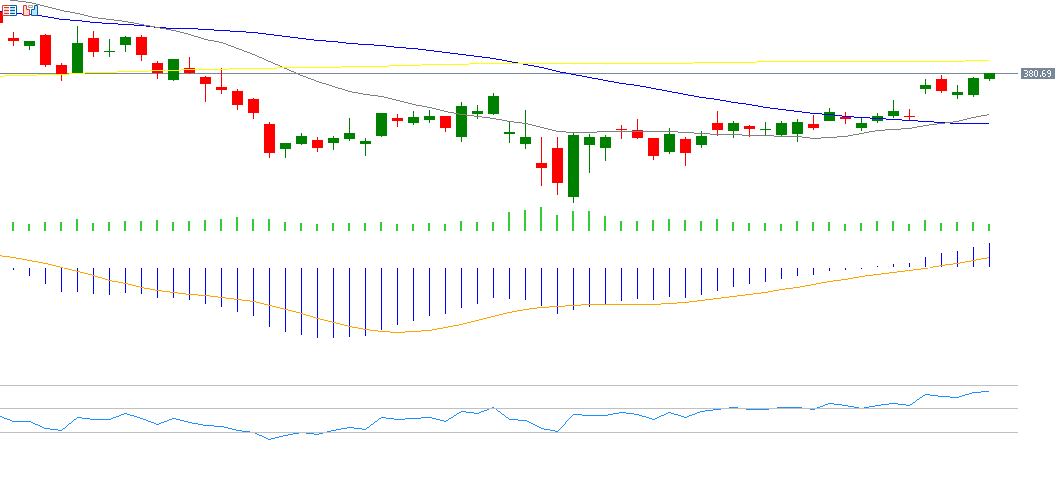
Home Depot’s stock is down about 2% year-to-date. Markets are awaiting the company’s earnings release on Tuesday, May 20, 2025, with expectations of an EPS of $3.61, compared to $3.63 in the previous reading. Revenue is projected to reach $39.37 billion, up from $36.42 billion previously.
The RSI is currently at 64, indicating bullish momentum for the stock.
Silver
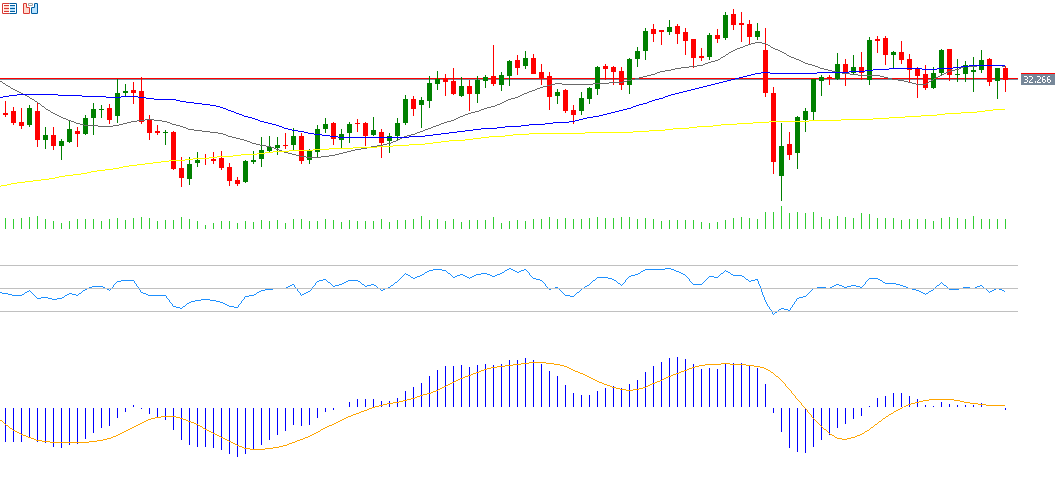
Silver prices fell by around 1% last week to $32.00 but remain up about 12% year-to-date. The recent decline is attributed to falling gold prices, easing trade tensions, and a global slowdown in industrial activity.
The RSI is at 47, signaling bearish momentum. The MACD shows a bearish crossover, with the MACD line (blue) crossing below the signal line (orange), indicating negative momentum for silver prices.
S&P 500
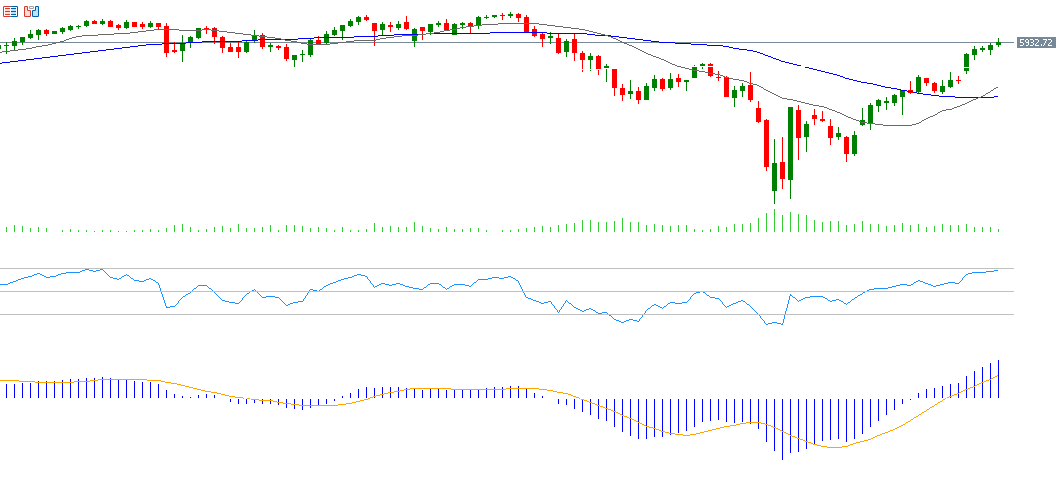
The S&P 500 index rose by about 5% last week, closing at 5,959 on Friday, May 16, 2025, marking its fifth consecutive daily gain.
This strong performance is driven by solid Q1 earnings results from U.S. companies and easing trade tensions, especially with China.
The RSI is currently at 70, reflecting strong upward momentum. The MACD also shows a bullish crossover, with the MACD line (blue) crossing above the signal line (orange), reinforcing positive momentum in the index.
Key Events This Week
Markets are anticipating several key economic indicators this week:
- Monday: China will release data on retail sales, industrial production, fixed asset investment, and unemployment. The Eurozone CPI will also be published.
- Tuesday: The Reserve Bank of Australia will announce its interest rate decision, with expectations of a 25-basis-point cut from 4.10% to 3.85%. The People’s Bank of China will set its prime lending rates, with forecasts suggesting a 10 bps cut on the 10-year rate (from 3.60% to 3.50%) and a 25 bps cut on the 1-year rate (from 3.10% to 3.00%). Canada will release its Consumer Price Index.
- Wednesday: Japan will report trade data (exports and imports), the UK will release its CPI, and the U.S. will publish weekly crude oil inventory data.
- Thursday: Flash PMI readings for manufacturing and services will be released in Australia, Japan, the UK, the Eurozone, and the U.S. Additionally, U.S. data on existing home sales and weekly jobless claims will be published.
- Friday: Retail sales data will be released in New Zealand, Japan, the UK, and Canada. The U.S. will publish new home sales figures.
Please note that this analysis is provided for informational purposes only and should not be considered as investment advice. All trading involves risk.


