
Key Points
- The Fed decides on Wednesday, with a hold at 3.75 to 4.00 percent about 90 percent priced and a December hike around 80 percent, in a week that also brings the BoC, RBNZ, ECB and BoJ, US GDP and PCE, and earnings from Alphabet, Microsoft and Amazon.
- Gold is trading at 4,013.75 after falling nearly 10 percent from its 19 September high near 4,400, breaking below the 4,065 low on 22 October and printing a new low near 3,975 at the start of the week.
- WTI crude is at 101.06, pulling back from Friday’s high near 103.90 after a rally of almost 20 percent from the 6 October low near 86.80, with Brent at its highest settlement since April on claimed Houthi attacks on Saudi Arabia.
Last Week in Review
Oil replaced AI as the market’s main worry. Brent settled at 116.72 on Friday, its highest since 29 April and up about 6 percent on the week, and WTI December rose to 103.27, after claimed Houthi attacks on Saudi Arabia that Riyadh has not confirmed. Higher oil revived inflation worries and Fed hike bets, and gold fell about 4.1 percent on the week to near 4,008 while silver lost 5.8 percent.
Earnings kept the AI spending debate alive. Meta grew revenue 26 percent but raised its 2026 capex floor to 135 billion dollars, Tesla beat with adjusted earnings per share of 0.48 and cut its investment plan to about 20 billion, and Netflix beat with earnings of 0.87 per share but guided fourth quarter revenue slightly below forecasts, sending shares about 4 percent lower after hours.
US equities ended the week mixed. The S&P 500 closed at 7,623.68, down about 0.5 percent, the Nasdaq fell for a second straight week and the Dow rose for a third, while the 10-year Treasury yield finished near 5.0 percent, down from an early-October peak above 5.3 percent. The Dollar Index was flat at about 101.8 and EUR/USD ended near 1.12 as French bond spreads stayed wide.
Gold: Range Breaks Lower as Oil Lifts Fed Hike Bets
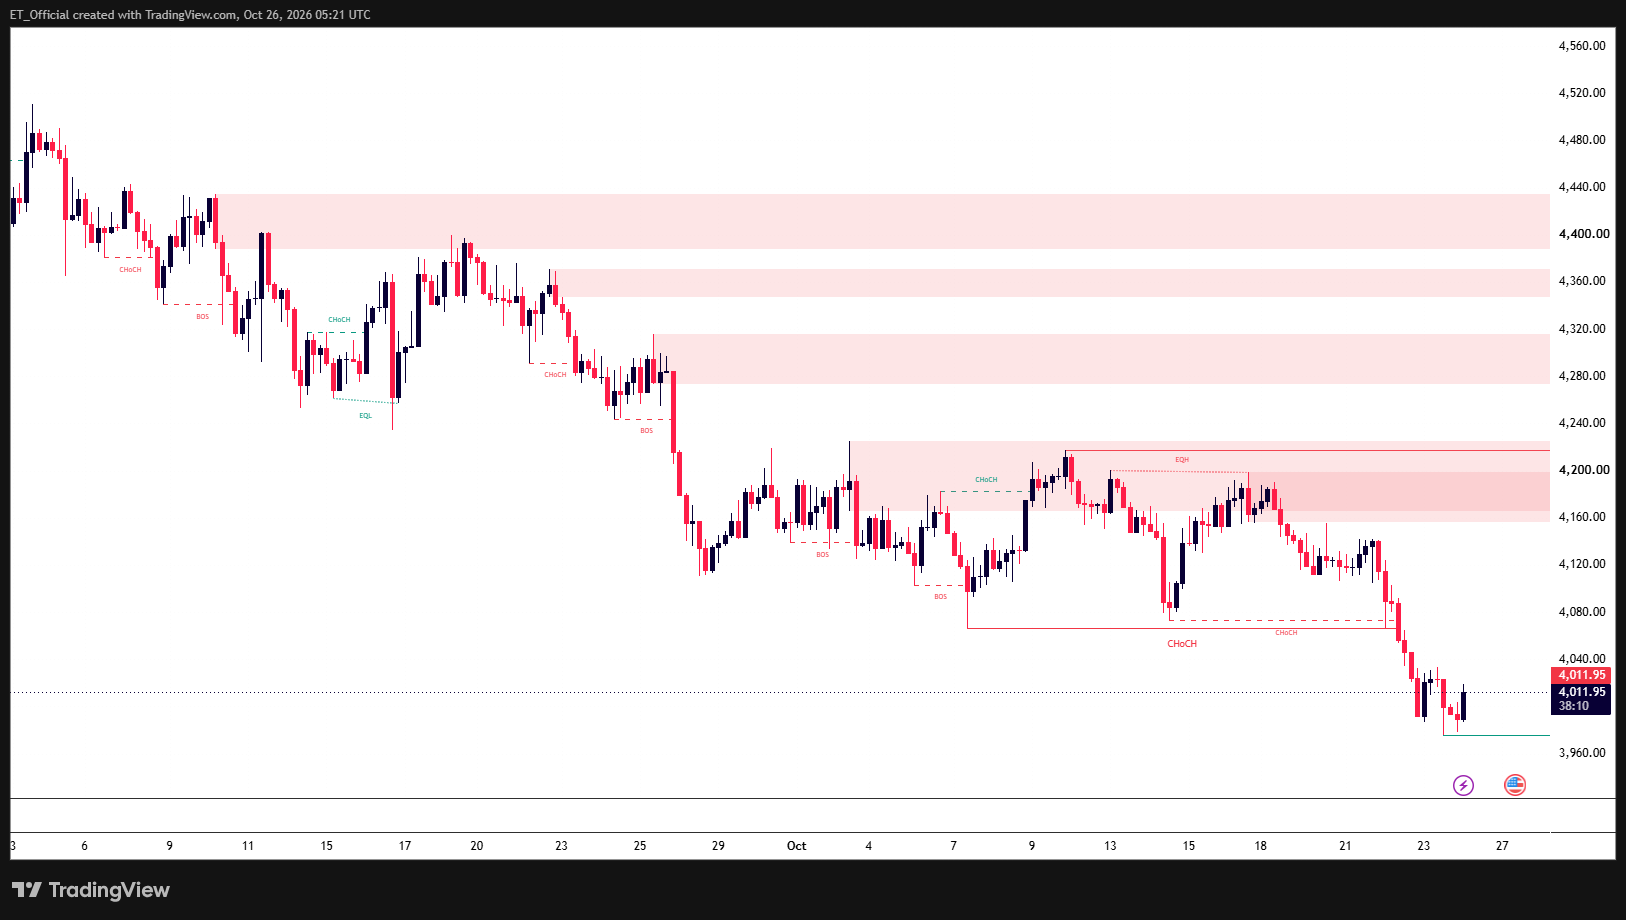
Chart: Gold (XAU/USD), 4H timeframe (TradingView, SMC)
Gold (XAU/USD) 4H chart, 10 September to 26 October 2026: price fell from a high near 4,400 on 19 September through a series of lower highs, broke below the 4,065 low on 22 October, and is now trading at 4,013.75 after a new low near 3,975.
The 4H chart shows gold in a persistent downtrend since the 19 September high near 4,400, with each rally making a lower high at 4,370, 4,315, 4,225 and 4,198 as price stepped down through successive supply zones. A three-week range between the 4,065 low from 7 October and the 4,225 high from 2 October held until last week.
That range failed on 22 October, when price broke below the 4,065 low and accelerated to a low near 3,987 on Friday, before a bounce and a fresh low near 3,975 at Monday’s open. Price is now at 4,013.75, trading around the 4,000 level that Metals Focus had flagged as a floor, with oil, yields and the Fed all pulling on it.
A recovery would first meet the broken 4,065 to 4,073 area, then the 4,141 high from 21 October and the 4,157 to 4,225 supply zone, and a hold above 4,000 would be the first sign the selling is exhausting. A decisive break of the 3,975 low would open a move with no marked support below, with Wednesday’s Fed, Thursday’s PCE and oil headlines the likely catalysts.
WTI Crude: Oil Shock Rally Pauses Below 104
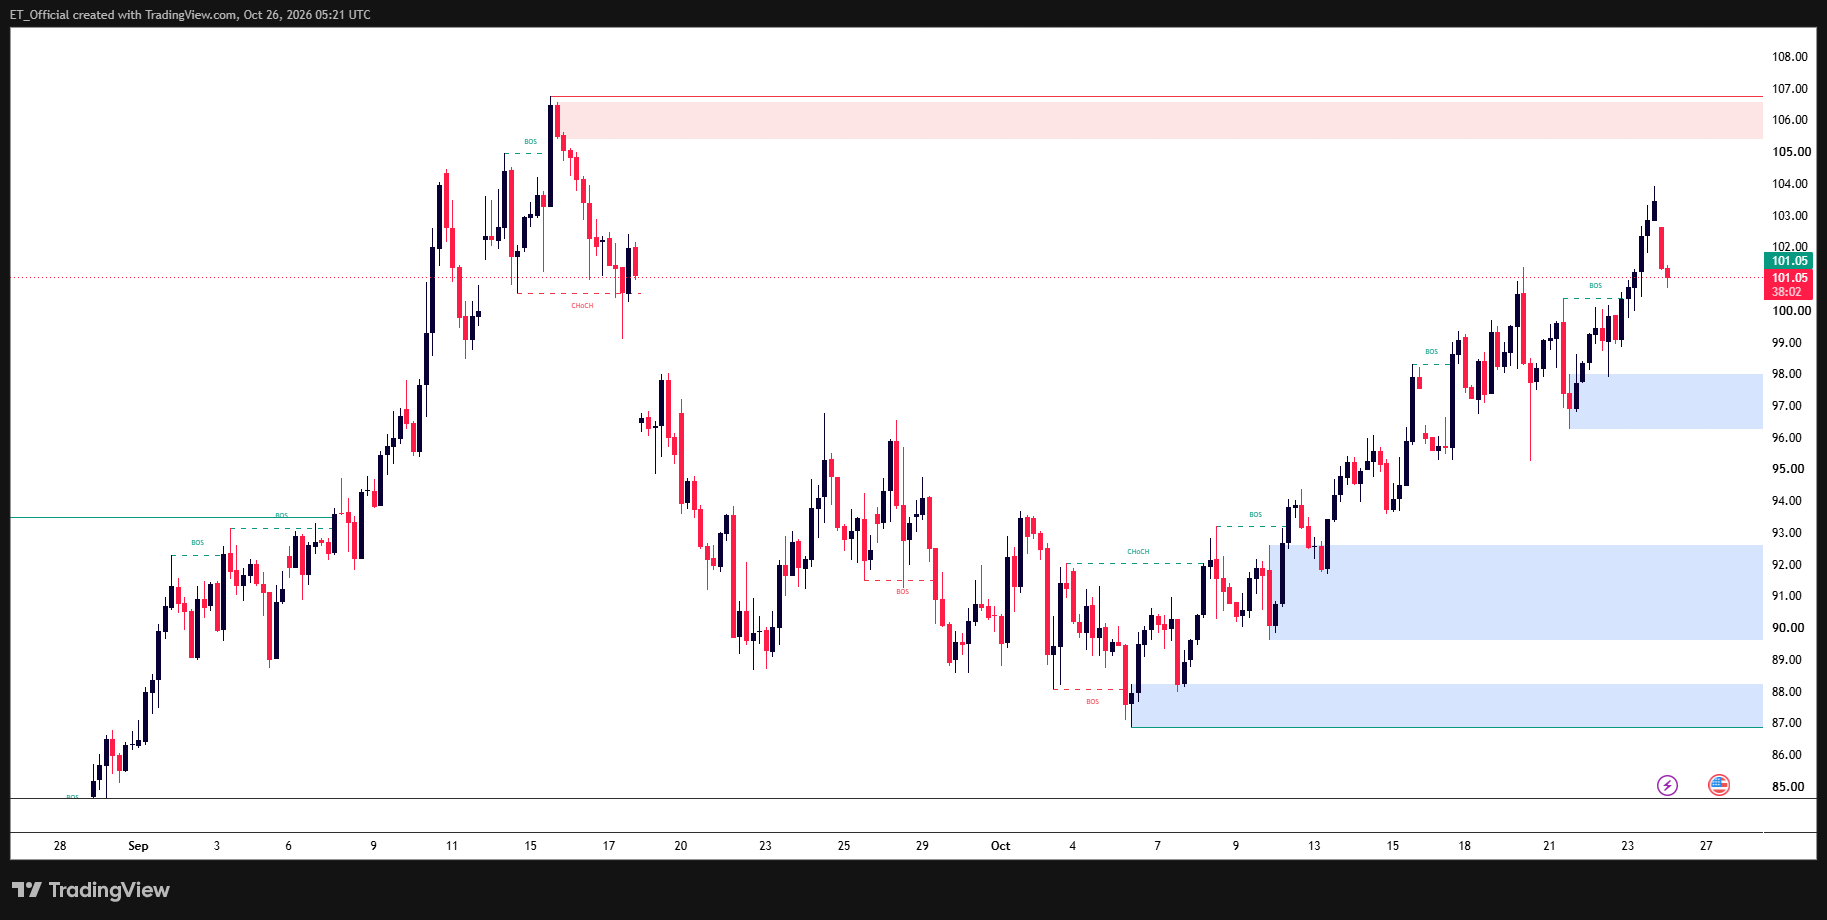
Chart: WTI Crude Oil, 4H timeframe (TradingView, SMC)
WTI crude oil 4H chart, 19 August to 26 October 2026: price spiked to a high near 106.70 in mid-September, fell to a low near 86.80 on 6 October, then rallied through higher lows to 103.90 on 23 October and is now trading at 101.06.
The 4H chart shows a spike to a high near 106.70 in mid-September, rejected from the supply zone at 105.40 to 106.55, followed by a drop to a low near 86.80 on 6 October. Price has since rallied almost 20 percent through a staircase of higher lows, with demand zones at 86.80 to 88.20, 89.70 to 92.60 and 96.30 to 98.00 holding on each dip.
The rally peaked at 103.90 on Friday, after Brent settled at its highest since April on new Houthi attacks on Saudi Arabia, and price pulled back to 101.06 on Monday as Qatari mediators visited Tehran. That pullback is still above the 100.40 break of structure level from 21 October, which is the first level to hold.
Below 100.40, the 96.30 to 98.00 demand zone is the next support, while a move back above 103.90 would target the 104.35 high from 11 September and then the 105.40 to 106.55 supply zone. Oil matters beyond the chart this week, because the Fed on Wednesday and PCE on Thursday will show how much of the energy shock is feeding into inflation.
Key Events This Week
Monday 26 October China Plenum and German Ifo
China’s Fifth Plenum runs through Thursday, with markets expecting governance signals rather than major stimulus, and Germany’s Ifo business survey is due. Asian stocks started cautiously, with Japan’s Nikkei flat after losing 4.0% last week and South Korea down almost 20% this month.
Tuesday 27 October Israeli Election and US Consumer Confidence
Israel votes in an election where neither bloc is expected to win a majority, alongside US durable goods, consumer confidence (about 80.5 expected) and the Richmond and Dallas Fed surveys. Boeing and UPS report before the US open.
Wednesday 28 October Fed, Bank of Canada and UK Budget
The Fed decides at 18:00 UTC with a hold at 3.75 to 4.00 percent about 90 percent priced and no new projections, so the vote split and Warsh’s press conference carry the weight. The Bank of Canada is priced about 80 percent to hike from 2.25 percent, the RBNZ is expected to raise to 3.00 percent, the UK Autumn Budget is expected to cut fiscal headroom to about 15 billion pounds from 23.6 billion, and Australian CPI is due. Alphabet and Microsoft report after the US close.
Thursday 29 October ECB, US GDP and PCE, Amazon
US third quarter GDP and September PCE land at 12:30 UTC, with GDP expected near 3.0 to 3.2 percent and PCE at 0.5 percent on the month and 3.6 percent on the year, with core at 3.1 percent. The ECB is expected to hold, with French bond spreads the likely focus of the press conference, and Amazon reports after the US close.
Friday 30 October Bank of Japan and Employment Cost Index
The Bank of Japan is expected to hold at 1.25 percent, with its Outlook Report and inflation assessment deciding whether a December hike is live. The US Employment Cost Index lands at 12:30 UTC, alongside third quarter GDP for the euro area, Germany and France and flash CPI across Europe.
Risk Warning: Trading financial instruments, particularly those involving leverage, involves a substantial degree of risk and is not appropriate for all investors. The value of your investments can rise or fall sharply, and it is possible to lose the entirety of your invested capital. Do not trade with funds you cannot afford to lose. Nothing in this site should be read or construed as constituting advice on the part of Taurex or any of its affiliates, directors, officers or employees.